Download
1 / 1
10 likes | 206 Views
0.2g. 0.3g. Application of New Liquefaction Hazard Mapping Techniques to the Sacramento-San Joaquin Delta - NH11A-1106 . VE ~ 275. Qfp-Qymc. Qfp-Qymc. C. R. Real 1 ( creal@conservation.ca.gov ), K.L. Knudsen 2 ( kknudsen@flash.net ), and M.O. Woods 3 ( mwoods@water.ca.gov )

E N D
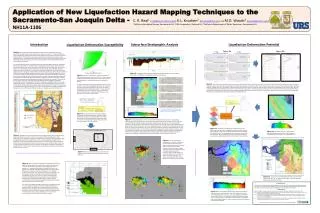
0.2g 0.3g Application of New Liquefaction Hazard Mapping Techniques to the Sacramento-San Joaquin Delta - NH11A-1106 VE ~ 275 Qfp-Qymc Qfp-Qymc C. R. Real1(creal@conservation.ca.gov), K.L. Knudsen2(kknudsen@flash.net), and M.O. Woods3(mwoods@water.ca.gov) 1California Geological Survey, Sacramento CA; 2URS Corporation, Oakland CA; 3California Department of Water Resources, Sacramento CA VE ~ 180 Qpm Qpm VE ~ 250 Introduction Subsurface Stratigraphic Analysis Liquefaction-Deformation Potential Liquefaction-Deformation Susceptibility VE ~ 375 Qm2e Cross-sections showing depth to the top and bottom of sand-prone, potentially liquefiable deposits (VE: vertical exaggeration). Figure 9a Figure 9b Abstract - Earthquake-induced liquefaction hazard maps have been prepared for the central Sacramento-San Joaquin Delta region exclusive of the channel levee system. The hazard assessment is based on deformation potential of naturally occurring sediments expressed as the capacity for horizontal displacement from limiting shear-strains caused by earthquake-induced cyclic shear stresses during earthquake shaking. For shaking corresponding to 10% in 50-year exceedance probability, the computed lateral displacement index ranges from zero to 9 ft, with the greatest deformation potential between Brentwood and Bethel Island. The new method allows for more knowledge of the three-dimensional spatial distribution of liquefiable sediments to reduce epistemic uncertainty in the mapping of liquefaction hazard. Recently improved relationships between fines-corrected penetration resistance, induced cyclic stress ratio, and shear- and volumetric -reconsolidation strain forms the basis of the methodology. Unconsolidated Quaternary geologic map units are reclassified into liquefaction-deformation susceptibility units based on statistical similarity of median average strain-depth functions calculated for arbitrarily assigned calibration conditions of 100% saturation and 40%g for sediment samples from over 3,000 borehole penetration tests. Areal grids of tops and bottoms of liquefaction-prone sediments were prepared by stratigraphic correlation of several hundred boring logs. Strain-depth density functions are then computed by grouping all borehole information within a defined liquefaction-deformation susceptibility unit, and parametrically modeling liquefaction response by varying shaking input assuming 100% saturation of sediments. At each grid cell the strain-depth density curve corresponding to the shaking level and liquefaction-deformation susceptibility unit is then integrated over the thickness of subsurface liquefiable sediments to estimate displacement potential. The final hazard maps represent hazard as lateral deformation and volumetric-reconsolidation potentials expressed as interval ranges of these displacement indices. The new approach has the distinct advantage of portraying hazard in more quantitative terms that relate to the potential for damage rather than surface features that may indicate non-damaging surface manifestation only. Qm2e Figure 6. Stratigraphic correlation panel showing levee (blue), peat (dark brown), soft organics (light brown), sand (yellow), and undifferentiated silts and clays (green). Figure 2. Contours of Shear-strain Potential as a function of earthquake-induced cyclic stress ratio and N1,60,cs. These curves, and a similar set for volumetric strain, permit the estimation of strains and displacements in sediments given prescribed earthquake loading. The strains are based on laboratory measurements under 15 cycles of uniform cyclic stress with negligible static stress (Wu, 2002), and for higher strains from back analysis of world-wide case histories filtered against static instability (Faris, 2004). They are considered “limiting strain” in that they represent an upper bound before dilatent re-stiffening sets in and liquefaction shuts down. They provide an index of deformation potential. Figure 9. Over 3,000 in situ penetration measurements were used to calculate shear (and volumetric) strains for the sands in 5-foot depth intervals throughout the area. Parametric modeling of liquefaction potential for all boring logs was simplified because depth to saturation is within a few feet of the ground surface over the study area (assumed 100% saturation), and ground shaking varies only a few tenths g. Borehole data were grouped by the previously defined surface liquefaction-deformation susceptibility units penetrated. Figure 9a shows resulting box-whisker plots (and fitted cubic-spline) for median shear strain and quartiles. The boxes show inter-quartile range, the central box bar is the median, the red dot the mean, and the whiskers the data range. Figure 9b shows the resulting liquefaction deformation response functions for shear strain (3rd-quartile strain-depth density) for the three liquefaction deformation susceptibility units and two levels of magnitude-weighted shaking. Figure 3. Average strain-depth curves are generated by averaging displacement potential index (DPI) (Faris, 2004) from the ground surface to increasing depth at increments of 10 feet for each boring log. Median average strain-depth curves are then computed by grouping boring log results by the surface geologic units they penetrate. • NO SPT BORING • - SPT BORING (feet) Figure 7. Isopach map and cross-sections showing thickness of liquefiable sands and silts. Sixty eight log correlation panels were prepared from hundreds of boring logs that define the late Pleistocene land surface upon which thick deposits of peat and organic clays formed. Extensive growth and decay of reeds, tules and other vegetation accompanied the rise in sea level and formation of the Sacramento-San Joaquin estuary following the last glacial retreat marking the onset of the Holocene. Peat/organic deposits are thickest in the northwest portion of the study area near Sherman Island (Figure 6), and thin toward the southeast. Age of the lowest peat deposits has been estimated at ~6,800 years bp. This late Pleistocene land surface consisted of extensive eolian dune deposits, which crop out today in the south-central portion of the study area. Knowledge of the depth and thickness of liquefiable material from stratigraphic modeling combined with results of parametric modeling of liquefaction allows for mapping the variability of limiting strain and pattern of deformation potential over much of the area. Figure 11. Displacement is estimated by integrating the response functions over the thickness of liquefiable sand-prone layer from depth-to-top to depth-to-bottom, using the appropriate curve for the cell location in the susceptibility grid. The stratigraphic thickness (structure contour) grids were prepared using conventional sub-surface spatial analysis employing inverse-distance weighted interpolation to derive sediment layer geometry. (g) Figure 10. Magnitude (duration) – weighted peak horizontal ground acceleration (g) for 10% exceedance probability in 50 years (475-year return ground motions). Qm2e Qpm Figure 1.Geologic map of the central Delta region showing the study boundary and the location of geotechnical boring logs used in this study. We used nearly 1,000 boring logs and over 3,000 penetration tests to reclassify the Quaternary Geologic map units mapped in the Delta (Atwater, 1982) into liquefaction-deformation susceptibility units. This was accomplished by development of a liquefaction response function based on strain potential as a function of depth. After correcting log data to fines-corrected standard penetration resistance (N1,60,cs), levee overburden was removed and the boring log datum shifted to the levee toe elevation for subsequent liquefaction modeling by the simplified method. This procedure allowed estimation of liquefaction potential for natural sediment deposits, exclusive of levees. Qymc Qfp Qfp-Qymc Depth (feet) Figure 8. 3-D view of boring logs throughout the study area. Also shown is the late Pleistocene land surface that marks the interface between the Holocene peat and organic deposits and the underlying eolian dune deposits. Readily visible is the pronounced thickening of peat and organic deposits toward the northwest, and the notable thickness of sand-prone deposits in the central area as shown in the lower right figure. Also evident are thick deposits of silt and clay (green) that commonly underlie the sands. Shear Strain % Figure 4.Median average strain-depth curves for the most pervasive and adequately sampled geologic units in the Delta study area. Figure 5. Map of liquefaction-deformation susceptibility for the central portion of the Sacramento-San Joaquin Delta. Median and quartile strain curves are computed from all boring logs penetrating a given surface geologic unit. Liquefaction-deformation susceptibility is defined in this manner under assumed conditions of 100% saturation and 40% g shaking. Differences in response then reflect only differences in the sediment properties of the various units. Boundaries of those surface geologic units having similar response are merged to form liquefaction-deformation susceptibility units, and a new response function computed from the combined total of borehole data (e.g. solid green curve resulting from combining the younger Holocene Marsh Creek unit (Qymc) with the undivided Holocene Floodplain Deposits (Qfp) that correspond to the blue and red dashed curves in the above figure). The result is three distinct liquefaction-deformation susceptibility units that are used to group boring log parameters for liquefaction potential and statistical analysis, enabling strain and displacements to be modeled as distributions. The distributions represent the variability of strain potential both horizontally and vertically in the sediment basin, and allow estimate of uncertainty in the analysis. The susceptibility units are a first-order accounting of the spatial variability of liquefaction response. Figure 13. Intervals of Lateral Deformation Potential produced from the grid shown in Figure 12. The green interval range is 1 foot, while the larger displacements are intervals of 3 feet. Conclusions The deformation-based method of mapping liquefaction hazard in the Sacramento-San Joaquin Delta shows great promise for improved portrayal of damage potential where abundant well-distributed geotechnical borehole data are available and the subsurface geometry of liquefaction-prone sediments can be mapped. (feet) References Atwater, B. (1982). “Geologic Maps of the Sacramento-San Joaquin Delta, California,” USGS MAP MF-1401, scale 1:2,400. Faris, A. (2004). “Probabilistic Models for Engineering Assessment of Liquefaction-Induced Lateral Spreading Displacements,” PhD. Thesis, University of California, Berkeley, California, 184 p. Real, C. and Knudsen, K. (2010) Collaborative research with URS, Corporation, California Geological Survey: Application of New liquefaction Hazard Mapping Techniques to the Sacramento-San Joaquin Delta Area : Final Technical Report for USGS Award Numbers 08HQGR0092-93. Wu, J. (2002). Liquefaction Triggering and Post Liquefaction Deformations of Monterey 0/30 Sand Under Uni-Directional Cyclic Simple Shear Loading. PhD. Thesis, University of California, Berkeley, CA, 381 p. Figure 12.Third-quartile Lateral Deformation Potential (LDP) (Shear-strain Displacement Potential Index) in feet. LDP is highest in the south-central study area where sand-prone units are the thickest and shallowest. Lower values of LDP are in the northwest portion of the study area where sands are relatively deep, and overlain by up to 60 feet of non-liquefiable peat and soft organic sediments. Similar maps were produced for Volumetric Reconsolidation Potential. Supported by National Earthquake Hazards Research Program Grant No. 08HQGR0092-93