Download
1 / 71
730 likes | 1.09k Views
Financial Statements and Cash Flow. Key Concepts and Skills. Understand the information provided by financial statements Differentiate between book and market values Know the difference between average and marginal tax rates Know the difference between accounting income and cash flow

E N D
Key Concepts and Skills • Understand the information provided by financial statements • Differentiate between book and market values • Know the difference between average and marginal tax rates • Know the difference between accounting income and cash flow • Calculate a firm’s cash flow
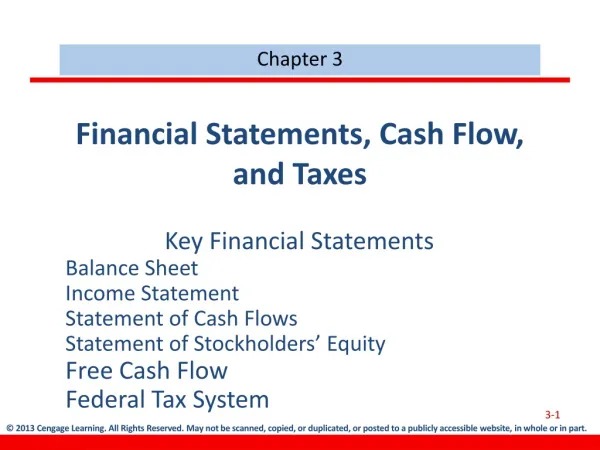
Chapter Outline 2.1 The Balance Sheet 2.2 The Income Statement 2.3 Taxes 2.4 Net Working Capital 2.5 Financial Cash Flow 2.6 The Accounting Statement of Cash Flows
Balance Sheet Analysis • When analyzing a balance sheet, the Finance Manager should be aware of three concerns: • Liquidity • Debt versus equity • Value versus cost
Liquidity:Composition of assets plays role • Refers to the ease and quickness with which assets can be converted to cash—without a significant loss in value • Current assets are the most liquid. • Some fixed assets are intangible. • The more liquid a firm’s assets, the less likely the firm is to experience problems meeting short-term obligations. • Liquid assets frequently have lower rates of return than fixed assets.
Debt versus Equity • Creditors generally receive the first claim on the firm’s cash flow. • Shareholder’s equity is the residual difference between assets and liabilities.
Value versus Cost • Under Generally Accepted Accounting Principles (GAAP), audited financial statements of firms carry assets at cost. • Market value is the price at which the assets, liabilities, and equity could actually be bought or sold, which is a completely different concept from historical cost.
2.2 The Income Statement • Measures financial performance over a specific period of time • The accounting definition of income is: Revenue – Expenses ≡ Income
Income Statement Analysis • There are three things to keep in mind when analyzing an income statement: • Generally Accepted Accounting Principles (GAAP) • Non-Cash Items • Time and Costs
GAAP • The matching principal of GAAP dictates that revenues be matched with expenses. • Thus, income is reported when it is earned, even though no cash flow may have occurred.
Non-Cash Items • Depreciation is the most apparent. No firm ever writes a check for “depreciation.” • Another non-cash item is deferred taxes, which does not represent a cash flow. • Thus, net income is not cash.
2.4 Net Working Capital • Net Working Capital ≡ Current Assets – Current Liabilities • NWC usually grows with the firm
$252m = $707- $455 $23 million $275m = $761m- $486m U.S.C.C. Balance Sheet 2007 2006 2007 2006 Current assets: Current Liabilities: Cash and equivalents $140 $107 Accounts payable $213 $197 Accounts receivable 294 270 Notes payable 50 53 Inventories 269 280 Accrued expenses 223 205 Other 58 50 Total current liabilities $486 $455 Total current assets $761 $707 Here we see NWC grow to $275 million in 2006 from $252 million in 2005. Long-term liabilities: Fixed assets: Deferred taxes $117 $104 Property, plant, and equipment $1,423 $1,274 Long-term debt 471 458 Less accumulated depreciation (550) (460 Total long-term liabilities $588 $562 Net property, plant, and equipment 873 814 Intangible assets and other 245 221 Stockholder's equity: Total fixed assets $1,118 $1,035 Preferred stock $39 $39 Common stock ($1 par value) 55 32 This increase of $23 million is an investment of the firm. Capital surplus 347 327 Accumulated retained earnings 390 347 Less treasury stock (26) (20) Total equity $805 $725 Total assets $1,879 $1,742 Total liabilities and stockholder's equity $1,879 $1,742
CHAPTER 3 Long-Term Financial Planning and Growth
Chapter Outline 3.1 What is Financial Planning? 3.2 A Financial Planning Model: The Ingredients 3.3 The Percentage Sales Method 3.4 What Determines Growth? 3.5 Some Caveats of Financial Planning Models 3.6 Summary and Conclusions
3.1 What is Corporate Financial Planning? • Corporate financial planning formulates the method by which financial goals are to be achieved. • Scenario Analysis • Each division might be asked to prepare three different plans for the near term future with regard to the assumptions about the company’s products and the state of economy. • A Worst Case • A Normal Case • A Best Case
3.2 The Ingredients of Financial Planning Model: • Sales forecast: Depends on • a detailed and dynamic macroeconomic study of uncertain future • investment opportunity • Pro forma statements: income statements, cash flow statements and balance sheet • Asset requirements: Prediction of both fixed and working capital requirements • Financial requirements including a focus of the dividend policy and debt policy of the firm • Plug: Suppose sales grows at one rate and assets grow at different rate then a third variable like dividend policy is plugged in to make them compatible. • Economic assumptions
1. Sales Forecast • All financial plans require a sales forecast. • Perfect foreknowledge is impossible since sales depend on the uncertain future state of the economy. Forecasts depend on the future of industry structure, strategy of competitors, technological progress, fiscal policies, consumer preferences etc. This makes sales forecast challenging. • Businesses that specialize in projection of macroeconomics and industry can help in estimating sales.
2. Pro Forma Statements • The financial plan will have a forecasted balance sheet, a forecasted income statement, and a forecasted sources-and-uses-of-cash statement. • These are called pro forma statements or pro formas.
3. Asset Requirements • The financial plan will describe projected capital spending. • In addition it will discuss the proposed uses of net working capital.
4. Financial Requirements • The plan will include a section on financing arrangements. • Dividend policy and capital structure policy should be addressed. • If new funds are to be raised, the plan should consider what kinds of securities must be sold and what methods of issuance are most appropriate.
5. Plug • Compatibility across various growth targets will usually require adjustment in a third variable. • Suppose a financial planner assumes that sales, costs, and net income will rise at g1. Further, suppose that the planner desires assets and liabilities to grow at a different rate, g2. These two rates may be incompatible unless a third variable is adjusted. For example, compatibility may only be reached if outstanding stock grows at a third rate, g3.
6. Economic Assumptions • The plan must explicitly state the economic environment in which the firm expects to reside over the life of the plan. • Interest rate forecasts are part of the plan. • Fiscal Policy like import duty, vat, tax holiday forecast is another.
Percent of Sales Approach • Some items vary directly with sales, others do not. • Income Statement • Costs may vary directly with sales - if this is the case, then the profit margin is constant • Depreciation and interest expense may not vary directly with sales – if this is the case, then the profit margin is not constant • Dividends are a management decision and generally do not vary directly with sales – this affects additions to retained earnings
Percent of Sales Approach (Contd..) • Balance Sheet • Initially assume all assets, including fixed, vary directly with sales. • Accounts payable also normally vary directly with sales. • Notes payable, long-term debt, and equity generally do not vary with sales because they depend on management decisions about capital structure. • The change in the retained earnings portion of equity will come from the dividend decision. • External Financing Needed (EFN) • The difference between the forecasted increase in assets and the forecasted increase in liabilities and equity.
The Steps in Estimation of Pro Forma Balance Sheet: • Express balance-sheet items that vary with sales as a percentage of sales. • Multiply the percentages determined in step 1 by projected sales to obtain the amount for the future period. • When no percentage applies, simply insert the previous balance-sheet figure into the future period. • Compute Projected retained earnings as: Present retained earnings + Projected net incomes - Cash Dividends = Projected retained earnings • Add the asset accounts to determine projected assets. Next, add the liabilities and equity accounts to determine the total financing; any difference is the shortfall. This equals the external funds needed. • Use the plug to fill External Fund Needed (EFN).
A Brief Example The Rosengarten Corporation is thinking of acquiring a new machine. The machine will increase sales from $20 million to $22 million—10% growth. The firm believes that its assets and liabilities grow directly with its level of sales. Its profit margin on sales is 10%, and its dividend-payout ratio is 50%. Will the firm be able to finance growth in sales with retained earnings and forecast increases in debt?
Current Balance Sheet Pro forma Balance Sheet (millions) (millions) Explanation Current assets $6 $6.6 g=10% Fixed assets $24 $26.4 g=10% Total assets $30 $33 g=10% Short-term debt $10 $11 g=10% Long-term debt $6 $6.6 g=10% Funds needed Common stock $4 $4 Constant Retained Earnings $10 $11.1 Net Income Total financing $30 $32.7 $300,000 A Brief Example
p = Net profit margin = 0.10 d = Dividend payout ratio = 0.5 DSales = Projected change in sales = $2 million The Percentage Sales Method: EFN • The external funds needed for a 10% growth in sales:
The Percentage Sales Method: EFN • The external funds needed
2005 $ 15.0 180.0 270.0 $ 465.0 680.0 (300.0) 380.0 $845.0 2004 $40.0 160.0 200.0 400.0 600.0 (250.0) 350.0 $750.0 Unilate CorporationBalance Sheets: Assets Cash A/R Inventories Total CA Gross FA Less: Dep. Net FA Total Assets
2005 $30.0 40.0 60.0 $130.0 300.0 $430.0 130.0 285.0 $415.0 $845.0 2004 15.0 35.0 55.0 $105.0 255.0 $360.0 130.0 260.0 $390.0 750.0 Unilate CorporationBalance sheets: Liabilities and Equity Accts payable Notes payable Accruals Total Current Liabilities Long-term debt Total Liabilities Common stock Retained earnings Total Equity Total Liabilities & Equity
Unilate Corporation Income statements Sales COGS Other expenses EBITDA Depr. & Amort. EBIT Interest Exp. EBT Taxes (40%) Net income Common Dividends 2005 $1500.0 (1,230.0) (90.0) 180.0 (50.0) $130.0 (40.0) $90.0 (36.0) $ 54.0 (29.0) 2004 $1435.0 (1,176.7) (85.5) 173.3 (40.0) 133.3 (35.0) $98.3 (39.3) $59.0 (27.0)
Balance Sheets 2005-2004Assets: Common size (Figures in million dollar)
Balance Sheets 2005-2004Liabilities & Equity: Common size (Figures in million dollar)
Income Statement 2005-2004Figures in million and common size
2005 25 $2.16 $1.16 $24.50 2004 25 $2.36 $1.08 $23.00 Other data Shares outstanding EPS DPS Stock price
Statement of Retained Earnings (2005) Balance of retained earnings, 12/31/04 Add: Net income, 2005 Less: Dividends paid Balance of retained earnings, 12/31/05 $260 54 (29) $285
Comment about the financial condition • The net change in cash flow is negative. The cash position of the firm has deteriorated compared to the last year. • Huge inventories are piled up. Abnormal increase in inventory in the current year [35%] does not match with sales promotion [4%]. • Accounts payable has increased as well. It seems that the firm procures inventories on credit and makes an unproductive stock. • Although profit performances go down but the firm makes higher payments of dividends. • The most important performance indicator is market price of share which has increased. This demonstrates that investors like the firm strategy to pile up inventories. In an inflationary economy that refers to hidden profit.
Comments of cash flow statement • Free cash flow is only 24 million which has gone down due to high investment in inventory • Cash flow to investor is $29 million that is financed by operating cash flow of $24 million and $5 million from creditors. Seems like dividends paid from borrowing. • Fixed investment has consumed huge cash
Profitability Analysis: DuPont Method a. Profit Margin on Sales =Net income/sales x b. Total Asset Turnover=Sales /Total Asset = c. Return on Assets (ROA) = Net Income/Total Assets x d. Financial Leverage=Total Assets/Common Equity = e. Return on Equity (ROE) =Net income (available to common stockholders)/Common Equity
DuPont analysis • A major set back is that ROA has gone down from 7.9% of the last year to 6.4% of the current year, when industry average is as high as 9.5%. The inefficiency is attributed to the decline in both profit margin and asset turnover ratios. • While enquiring into the reason behind the decline in profit margin we have seen the growth rate of the cost composition and sales (see following slides). It can be seen that abnormal increase took place in depreciation and interest charges. Increase in depreciation is related to increase in fixed assets. Is the firm holding too much fixed assets? Fixed asset turnover increases from 3.9 to 4.1. This is partially responsible. Increase in interest charges may be due to off-balance sheet financing or higher debt. The growth rate of debt is 16.5% (compared to the growth of interest of 14%) which rules out the role of off-balance sheet financing. • Asset turnover rate declined because of poor growth in sales (4.5%) and higher growth in assets (12.7%). The asset composition shows that the proportion of current assets to total assets has increased from 53% to 55%. This merits attention to the composition of current assets. The growth of current assets is 16% which by itself is high. Growth of cash is negative 63% and that of accounts receivable is 13%. What is noticeable is the growth of inventories which is as remarkable as 35%. This must have contributed to the inefficiency of asset management.
DuPont analysis (Contd.) • Increase in financial leverage suggests that growth of total debt is higher than that of equity. Total debt grew by 19.4% and equity grew by 6.4%. Increased financial leverage is also reflected in higher interest payments (from $35m to $40m). This should have contributed to a promotion of return on equity. However, the firm could not take advantage of non-taxable interest charges as because EBIT could not be promoted. In fact, EBIT has rather gone down from $133m to $130 million. As a result, although tax payment has gone down from $39.3m to $36m but return on equity has also gone down. • An enquiry into the debt composition shows that the proportion of long term debt into total debt was consistent around 70%. The growth rate short term liability (23%) is higher than that of long term liability (17.6%). Highest growth rate was that of accounts payable which doubled from that of the previous year. It has been noticed earlier that inventory grew by 35%. Now, we see that accounts payable has been doubled. This indicates that the firm is making use of facility of credit purchase and piling up inventory.