Download
1 / 25
250 likes | 420 Views
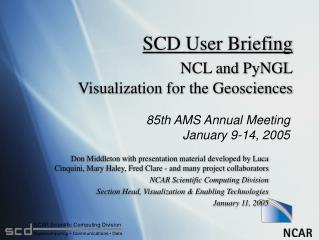
SCD User Briefing NCL and PyNGL Visualization for the Geosciences. 85th AMS Annual Meeting January 9-14, 2005. Don Middleton with presentation material developed by Luca Cinquini, Mary Haley, Fred Clare - and many project collaborators NCAR Scientific Computing Division

E N D
SCD User BriefingNCL and PyNGLVisualization for the Geosciences 85th AMS Annual Meeting January 9-14, 2005 Don Middleton with presentation material developed by Luca Cinquini, Mary Haley, Fred Clare - and many project collaborators NCAR Scientific Computing Division Section Head, Visualization & Enabling Technologies January 11, 2005
Topics • NCAR Command Language (NCL) • GSUN (NCL visualization interface) • PyNGL • Example codes and visualizations • Future plans
What is NCL? • NCAR Command Language • Scripting language, powerful in 3 areas: • File input/output • Data processing • Publication-quality visualizations • Runs on Linux, MacOSX, Solaris, IRIX, AIX, OSF1, Cygwin
NCL File I/O Based on the netCDF model: • Read/write netCDF, HDF4, ASCII, binary • Reads GRIB, including ECMWF complex coefficients • One interface for several data formats
NCL Data Processing Over 600 functions and procedures: • Spherical harmonic based calculations • Scalar and vector regridding • Vertical interpolation, including hybrid coordinates to pressure level • Spectral/cross spectral and wavelet analysis Can access Fortran and C routines directly from NCL
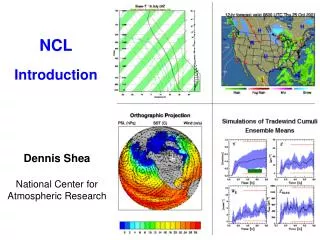
NCL Visualization Publication-quality visualizations: • Contour, line, vector, streamline, map • Customization: hundreds of options • Output to X11, PostScript, PDF • Lots of examples
GSUN: interface to NCL visualization • “Getting Started Using NCL” • Successful collaboration w/CCSM users • User-friendly, customized visualization functions • Extensive documentation and examples • Interface of choice for NCL visualization • GSUN used as a model for PyNGL
What is PyNGL? • Python NCL Graphics Library • Python version of popular GSUN interface • Same publication-quality graphics as NCL • Utilizes existing Python modules • Multiple output formats • Extensive documentation
PyNGL GSUN import Ngl from Scientific.IO.NetCDF import * # Open the NetCDF file. nfile = NetCDFFile("meccatemp.cdf","r") # Get lat/lon/temperature variables. lat = nfile.variables["lat"][:] lon = nfile.variables["lon"][:] T = nfile.variables["t"][0,:,:] # Open a PS workstation. wks = Ngl.open_wks("ps","mecca") # Set contour & scalar field resources. res = Resources() res.sfXArray = lon res.sfYArray = lat # Tickmarks displayed by default. # Size maximized by default. # Draw contours over a map contour = Ngl.contour_map(wks,T,res) Ngl.end() load "gsn_code.ncl" begin ; Open the NetCDF file. nfile = addfile("meccatemp.cdf","r") ; Get lat/lon/temperature variables. lat = nfile->lat lon = nfile->lon T = nfile->t(0,:,:) ; Open a PS workstation. wks = gsn_open_wks("ps","mecca") ; Set contour & scalar field resources. res = True res@sfXArray = lon res@sfYArray = lat res@pmTickMarkDisplayMode = “Always” res@gsnMaximize = True ; Draw contours over a map. contour = gsn_contour_map(wks,T,res) end
From a presentation of Jeff Kiehl (NCAR) and Tim Schneider (NOAA)
Wind velocity vectors Data from the MECCA Project
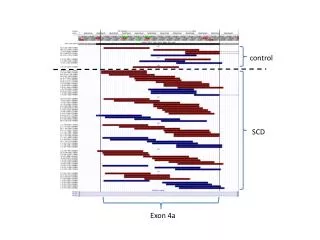
Based on a visualization of Joel Norris (Scripps) using synthetic data
Contouring on arbitrary triangular meshes Image from Jonathan Shewchuk, author of Triangle
Future PyNGL plans • Pythonize NCL’s powerful I/O module and climate and interpolation functions • Add more functionality and examples
PyNGL/NCL Documentation: http://www.pyngl.ucar.edu/ http://ngwww.ucar.edu/ncl/ PyNGL/NCL talk email lists:http://www.pyngl.ucar.edu/pyngl-talk/ http://ngwww.ucar.edu/ncl/ncl-talk/ Download PyNGL/NCL: http://www.pyngl.ucar.edu/download.html http://ngwww.ucar.edu/ncl/download.html