Download
1 / 22
220 likes | 351 Views
MADISON COMMUNITY OPERATIONS CARBON INVENTORY 2012 Adam Anderson Tyler Brandt Iseul Choi Bridget Holcomb Kendi Larrabee Leona Yi-Fan Su. Introduction. ● La Follette School of Public Affairs ● Special Thanks to Jeanne Hoffman

E N D
MADISON COMMUNITY OPERATIONS CARBON INVENTORY 2012 Adam Anderson Tyler Brandt Iseul Choi Bridget Holcomb KendiLarrabee Leona Yi-Fan Su
Introduction ● La Follette School of Public Affairs ● Special Thanks to Jeanne Hoffman ●International Council for Local Environmental Initiatives (ICLEI) ● Goals and Importance
Inputs Sectors for community emissions analysis ●Madison energy ●Residential energy ●Commercial energy ●Industrial energy ● Transportation and mobile devices ● On- and off- road transportation ● Public transportation: public transit ● Waste ● Solid and water waste generated by households and businesses
Data Collecting ●Data were gathered from state and local governmental departments, as well as private organizations. ●Energy: Madison Gas and Electric (MGE) & Alliant Energy ●Transportation: Madison Metro Transit, DNR and Regional Airport ●Waste: Dane County Public Works and Madison Metropolitan Sewerage District ●Demographic data: U.S. Census Bureau
Results • ● 2012 4,438,398 metric tons of CO2ecompared to 3,954,293 • metric tons in 2010 • ● 18.5 metric tons per person • WI average 16.7 metric tons in 2011 Madison Resident (18.5 metric tons) U.S. (16.9 metric tons) Wisconsin Resident (16.7 metric tons)
Top 3 Energy Sectors Remain the Same ● Commercial energy, transportation, and residential energy remain the top 3 emitters.
CO2e Reduction Strategies ● Commercial Energy – Benchmarking ● Transportation – Bus Rapid Transit ● Residential Energy – Solar Electricity Generation
Commercial Building Energy Benchmarking Requirement that owners of buildings with more than a specified amount of square footage must publicly report information regarding building energy consumption. ● Energy Star Portfolio Manager ● 35,000 Buildings tracked from 2008 - 2011 ● 2.4% Annual reduction ● 7% total reduction over study period ● Study of California IOUs Program ● 0.13 kWhs/square foot ●0.002 therms/square foot
Commercial Building Energy Benchmarking At a threshold of 25,000 square feet ●5,859 metric tons of CO2e per year ● 1,233 passenger vehicles per year ●535 residential homes per year
Residential: Solar Energy ● The City of Madison has been promoting solar technology at the local level since 2007 ●MadiSUN program
Forecasting Logistics ● Target 1 Megawatt by 2020 (Start year 2015) ● Average cost for installation $5.00/W ● $620,000 annual spending required for constructions through 2020 ●Focusing on solar energy in residential sector (Using 2012 Residential price for electricity $.1188/kWh) ● Expecting 200 kW installed capacity will be annually deployed through 2020
Thank you ! Questions ?
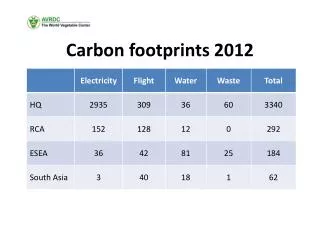
Energy Consumption and CO2e Emissions by Sector and Source for 2012
Energy Consumption and CO2e Emissions by Sector and Source for 2012