Download
1 / 1
10 likes | 92 Views
1 st 2 nd 3 rd 4 th 5 th 6 th 7 th 8 th 9 th. baseline. Week. Additional file 3. Note: P < 0.05~0.001 vs Sham group ( from 2nd week ).

E N D
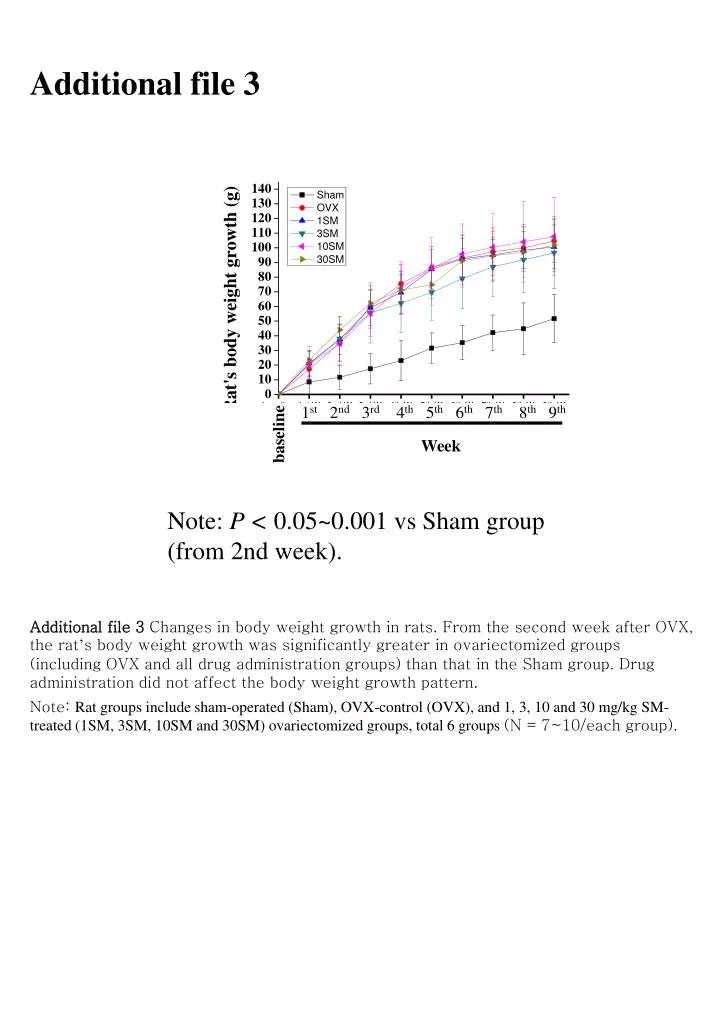
1st 2nd 3rd 4th 5th 6th 7th 8th 9th baseline Week Additional file 3 Note: P < 0.05~0.001 vs Sham group (from 2nd week). Additional file 3Changes in body weight growth in rats. From the second week after OVX, the rat’s body weight growth was significantly greater in ovariectomized groups (including OVX and all drug administration groups) than that in the Sham group. Drug administration did not affect the body weight growth pattern. Note: Rat groups include sham-operated (Sham), OVX-control (OVX), and 1, 3, 10 and 30 mg/kg SM-treated (1SM, 3SM, 10SM and 30SM) ovariectomized groups, total 6 groups (N = 7~10/each group).