Download
1 / 9
90 likes | 223 Views
City of Bend Water Treatment Advisory Group Present Worth Cost Comparison. Membranes VS. UV Disinfection. 20-Year Present Worth Cost Assumptions. 6% rate UV - Revised Capital Cost Estimates 5% Contingency Added to Membrane Alt A and Alt B

E N D
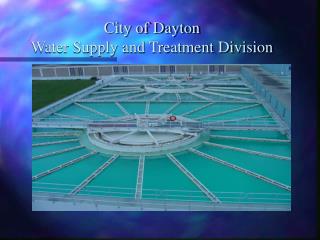
City of BendWater Treatment Advisory GroupPresent Worth Cost Comparison Membranes VS. UV Disinfection
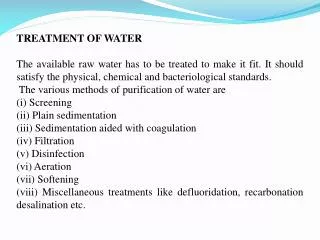
20-Year Present Worth Cost Assumptions • 6% rate • UV - Revised Capital Cost Estimates • 5% Contingency Added to Membrane Alt A and Alt B • Added diversion storage to membrane option – needed post fire • Adjusted UV contingency for common elements • WWTP treatment costs not included for membrane option • Revised power cost projection – see chart • UV Power Consumption – 500,000 kWh/Year • New wells constructed to provide 12.5 mgd reliable capacity during high turbidity @ $1.3/gallon capital cost • Wells operated 25% of time - turbidity events • Wells - 600 ft TDH average • Well pump efficiency 80% • Labor cost 2 people @ $31/hour – wells and UV
Revised Electrical Power Cost ProjectionMid Columbia Wholesale Power Price Forecast6th Northwest Power Planning Council
Membranes Vs. UV20-Year Present Worth Cost Comparison * Started at $502,000 per year (city number) and escalated at 3 percent per year. UV/well O&M, less power costs, also escalated at 3 percent per year
What Happens With Fire? • Membrane System Costs include alternatives to allow some pretreatment but not post-treatment. Potential taste and odor issues even with pre and post treatment • UV System would be abandoned. 12.5 mgd of wells would increase operation from 25% of time to 100% of time. No taste and odor issues. • Abandoned cost is approx. $3 million
Post Fire Membranes Vs. UV20-Year Present Worth Cost ComparisonWorst Case – Catastrophic Fire Immediate Post Construction
Conclusions • UV plus 12.5 mgd of wells meets LT2, protects public health, • Approx. $10 million lower 20-year PW Cost, • Provides more capacity, • More reliable • If catastrophic fire – use wells 100% of time. • Still lower PW cost • No post fire water quality impacts