Download
1 / 30
300 likes | 621 Views
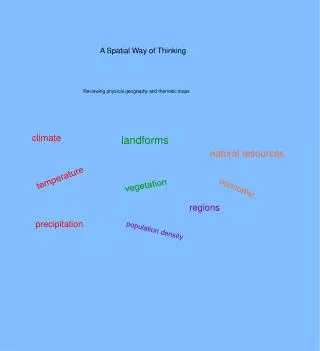
Seeing the world like a geographer. A Spatial Way of Thinking. Why do geographers use maps?. Maps help geographers understand and explain the features of the earth. Remember Human & physical geography? Which is human, which is physical?. What are geographic “features”?.

E N D
Seeing the world like a geographer A Spatial Way of Thinking
Why do geographers use maps? • Maps help geographers understand and explain the features of the earth. • Remember Human & physical geography? • Which is human, which is physical?
What are geographic “features”? • Features = what is on the earth (human and physical) • Physical Features: natural parts earth surface and environment. | pics |Examples: • Landforms: mtns, valleys, plains (on land) • Bodies of water: oceans, seas, lakes, rivers • Climate: type of weather over long periods of time | ex | • Vegetation: plant life in a particular area
Human Features: Things humans have created on earth. Examples: countries, population, religion, economic activity. | pics |
Thematic Maps • What are “thematic maps”? • A map that shows one theme or topic • How / why do geographers use thematic maps? • Thematic maps help explain “where” the topic is. (What topic is happening where) • But also… who, when, and if used correctly, can help explain why. | Maps 1 | maps 2 |
Geography is more than just where things are! • Thematic maps can be used to answer important questions. • Is there a problem with gun violence in the U.S.? • Do gun laws work? • How does the U.S. compare with the rest of the world? Education, health care, jobs, cost of living, safety..? • Which countries spend the most money on their military? Why? | map |
Are thematic maps all I need to look at to understand the world? • Yes or no? Why or why not? • What are some problems with thematic maps? • Who made the map and why (purpose / bias)? When was the map made? Is the information accurate?
How do I understand a thematic map? • Title + Legend
6 Common Thematic Maps • Physical Features: mtns, valleys, plains, elevation (on land) | map | • Climate: type of weather over long periods of time | ex | map | • Vegetation: plant life in a particular area | map | Activity: Hand out climate and vegetation descriptions sheets. Finish wksts.
4. Population Density: • tells us how crowded a place is. # of people per mile / kilometer. | map | • How to calculate: PD = total # of people ÷ total land area • The higher the result, the more crowded the place is.| Example | Activity: Finish wkst.; GA population map questions; Classroom representation (use tiles);
5. Economic Activity: how use land and resources to make a living | map | Examples: • Subsistence farming, hunting and gathering, forestry, trade and manufacturing, recreation • Activity: Finish wkst.; GA map questions; GA Classroom Act outs;
6. Region: an area defined by one or more natural or cultural characteristics that set it apart from other areas. | world regions map | Examples: • The Northwest, Latin American, The Arctic Region, Portland Transit, China Town, The Heartland, The Middle East, Down Town • What examples can you think of?
World Climate Zones Climagraphs for the 12 climate zones found around the world are shown above. | back |
Google map car with camera • | back |
What is PD of Redmond, Or.? • 26, 646 ÷ 16.79 = • In 2007, New York City PD = more than 26,000 people per square mile. | back | 1,587 people per sq mile.
Most PD cities in world: • Hong Kong, China • Lagos, Nigeria • Dhaka, Bangladesh • Jakarta, Indonesia • Mumbai, India • Ahmadabad, India • Ho Chi Minh City, Vietnam • Shenyang, China • Bangalore, India • Cairo, Egypt • | back |