Download
1 / 4
0 likes | 2 Views
This PDF will help you to know 4 Executive Dashboards Every Business Needs for Smarter Insights. To get more insights on these sites, visit: https://empmonitor.com/blog/executive-dashboards/

E N D
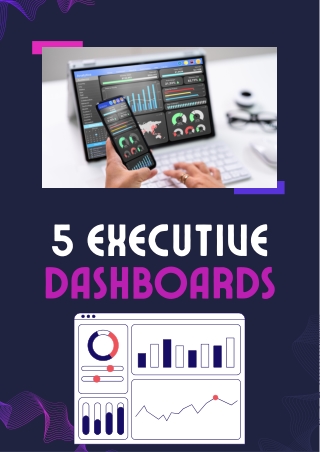
5 EXECUTIVE DASHBOARDS
INTRODUCTION In today's data-driven world, businesses rely heavily on dashboards to make informed decisions and optimize performance. Executive dashboards offer a real-time, visual representation of key business metrics, helping leaders quickly grasp the state of various departments. From sales to operations, these tools provide valuable insights that drive better business strategies and improved outcomes.
SALES PERFORMANCE DASHBOARD – This dashboard tracks key sales metrics such as revenue, conversion rates, and sales pipeline progress, offering insights into sales growth trends and performance against targets. It helps identify top-performing products or services and breaks down sales by region, team, or channel, enabling teams to optimize strategies and forecast future revenue. MARKETING DASHBOARD – The marketing dashboard monitors the performance of campaigns, lead generation, and customer acquisition. It measures metrics like website traffic, email open rates, ad performance, and social media engagement. By visualizing ROI from different marketing channels and tracking lead conversion, it ensures marketing spend aligns with business goals and helps optimize campaigns for better outcomes. FINANCIAL DASHBOARD – A financial dashboard provides a snapshot of the company’s financial health, including revenue, expenses, cash flow, and profitability. It displays key financial ratios, highlights trends in cash flow and debts, and compares actual versus forecasted financials, giving leaders the insights needed to manage costs and plan for future growth. OPERATIONAL DASHBOARD The processes, including inventory levels, supply chain performance, and production efficiency. It monitors KPIs such as order fulfillment rates, production uptime, and delivery businesses optimize operations, reduce bottlenecks, and ensure efficient resource management. operational dashboard tracks internal performance, helping
FINAL WORD: Leveraging the right dashboards is crucial for staying competitive and efficient. By using specialized dashboards for sales, marketing, finance, customer insights, and operations, businesses can gain a comprehensive understanding of their performance. These insights empower teams to make data- backed decisions that lead to growth, increased profitability, and better customer satisfaction. https://empmonitor.com/blog/executive-dashboards/