Download
1 / 18
180 likes | 213 Views
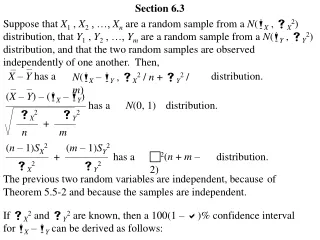
Section 6.3. Confidence Intervals for Population Proportions. Point Estimate for Proportions. The Population Proportion is called p The Point Estimate is the sample proportion is called “p hat”. To find the Margin of Error, E. Confidence Intervals for the Population Proportion.

E N D
Section 6.3 Confidence Intervals for Population Proportions
Point Estimate for Proportions • The Population Proportion is called p • The Point Estimate is the sample proportion is called “p hat”
Construct a C.I. for the Proportion • 1. Find n and x to find p-hat • 2. Make sure the normal approximation is allowed • 3. Find the critical value zc that corresponds with the given level of confidence. • 4. Find the margin of error, E. • 5. Find the left and right endpoints and form the confidence interval.
EX from p 325-326 • 14. In a survey of 4013 US adults, 722 say they have seen a ghost. Construct a 99% C.I. for the population proportion of US adults who have seen a ghost. • 16. In a survey of 2303 US adults, 734 believe in UFOs. Construct a 90% C.I. for the population proportion of US adults who believe in UFOs.
20. You wish to estimate, with 95% confidence, the population proportion of US adults who say chocolate is their favorite ice cream flavor. Your estimate must be accurate within 5% of the population proportion. • A) No preliminary estimate is available. Find the minimum sample size needed. • B) Find the minimum sample size needed, using a prior study that found that 28% of US adults say that chocolate is their favorite ice cream flavor. • C) Compare results from parts (A) and (B)
Which Table do I use??? • Confidence Interval for MEAN: • If σ is known, use the Z table. • If σ is unknown, consider the sample size n. • If n > 30, use the Z table. • If n < 30, use the T table. • Confidence Interval for PROPORTION: • Use the Z table. • C.I. for VARIANCE or STANDARD DEVIATION: use CHI-Squared Table.
Section 6.4 Confidence Intervals for Variance & Standard Deviation
Point Estimates • Population variance is σ2 • The point estimate for variance is s2 • Population standard deviation is σ • The point estimate for standard deviation is s.
The Chi-Square Distribution (table #6) Chi-Square = X2 • Use for sample sizes n > 1 • All X2> 0 • Uses Degrees of Freedom: d.f. = n – 1 • Area under the curve = 1 • Chi-Square distributions are positively (or right) skewed. • NOTE: The shaded area is to the RIGHT!
Finding Critical Values for X2 • X2R is the RIGHT hand critical value. To find this, use ½ of c as αon the table. • X2L is the LEFT hand critical value. To find this, use the COMPLEMENT of ½ of c as α on the table. • Keep in mind that X2L < X2R
Find the critical values X2L & X2R • 7. c = 0.95 n = 20 • 8. c = 0.80 n = 51
Confidence Interval for Variance • Remember… intervals are always left to right, smaller to larger!
To find Confidence Intervals • 1. Verify the population has a normal distribution. • 2. Find degrees of freedom: d.f. = n – 1 • 3. Find point estimate s2, use StatCrunch if needed. • 4. Find critical values using chi-square table. • 5. Find the left and right endpoints for the C.I. for the population VARIANCE. • 6. Square root to find the left and right endpoints for the C.I. for the population STANDARD DEVIATION.
Examples from p 334-5 • 10. The volumes (in fluid ounces) of the contents of 15 randomly selected bottles of cough syrup are listed. Construct a 90% C.I. for the population variance and the standard deviation. (Assume the population is normally distributed.) 4.211 4.264 4.269 4.241 4.260 4.293 4.189 4.248 4.220 4.239 4.253 4.209 4.300 4.256 4.290
18. A magazine includes a report on the prices of subcompact digital cameras. The article states that 11 randomly selected subcompact digital cameras have a sample standard deviation of $109. Assume the population is normally distributed. Construct a CI for the population variance and standard deviation using an 80% level of confidence.