Download
1 / 52
520 likes | 535 Views
This presentation discusses important updates to the Current Population Survey Annual Social and Economic Supplement (CPS ASEC), including questionnaire redesign, data processing improvements, and expanded information on income and health insurance coverage. Highlights of the 2018 income and poverty data are also provided.

E N D
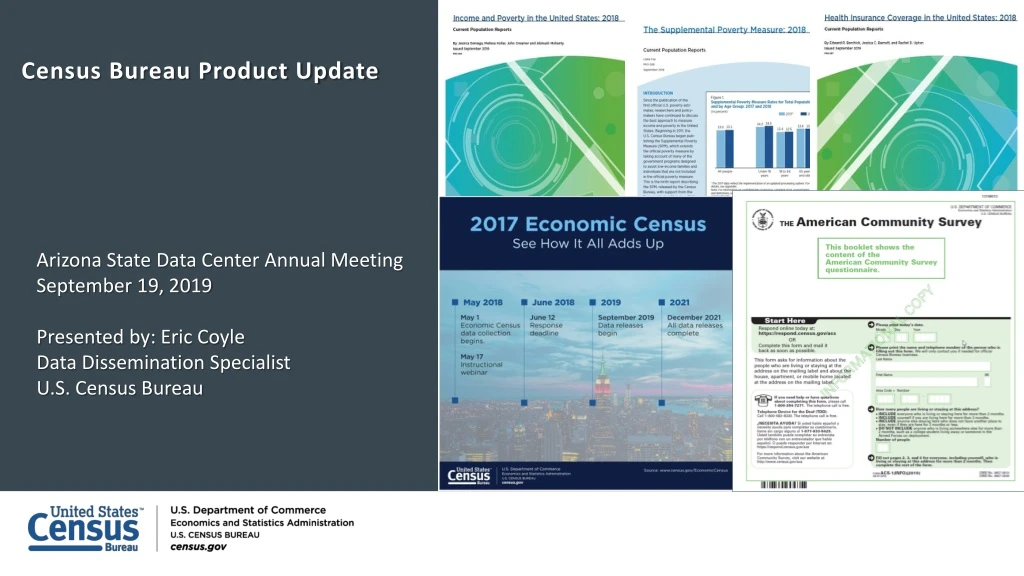
Census Bureau Product Update Arizona State Data Center Annual Meeting September 19, 2019 Presented by: Eric Coyle Data Dissemination Specialist U.S. Census Bureau
Agenda Current Population Survey Annual Social and Economic Supplement • 2018 Income, Poverty, and Health Insurance Reports American Community Survey • 2018 1-year estimates release schedule 2017 Economic Census • Release and latest changes Census Business Builder • 2.6 Update Census Academy & Additional Resources Q&A
Important CPS ASEC SurveyUpdates • The CPS ASEC has undergone a redesign of the questionnaire and data processing system. • Questionnaire design changes incorporated over the period of 2014 to2016: • Updated income and means-tested benefitquestions • Redesigned health insurancequestions • Expanded family relationshipcategories 4
Important CPS ASEC SurveyUpdates • The CPS ASEC has undergone a redesign of the questionnaire and data processing system. • Questionnaire design changes incorporated over the period of 2014 to2016: • Updated income and means-tested benefitquestions • Redesigned health insurancequestions • Expanded family relationshipcategories • Data processing changes reflected for the first time thisyear: • Improvements to how income data is edited andimputed • More comprehensive and consistent treatment offamilies • Expanded data on health insurance coverage andsources 5
Important Reminders • Estimates for 2017 and 2018 reflect the updated processing system. • 2017 estimates may differ from those published lastyear. • For moreinformation: • CPS ASEC Redesign & Processing Changes website: https://census.gov/data/datasets/time-series/demo/income- poverty/cps-asec-design.html • Pre-release webinar on improvements to the CPS ASEC and implications for estimates: https://www.census.gov/data/academy/webinars.html • 6
Data are based on the Current Population Survey’s Annual Social andEconomic Supplement (CPS ASEC) from March 2019. • CPS ASEC is the official source of national poverty estimates. • Official poverty estimates are calculated in accordance with OMB Statistical Policy Directive14. 7
Highlights • Median household income was $63,200 in 2018, not statistically different from the 2017median. • The 2018 real median earnings of men ($55,300) and women ($45,100) who worked full-time, year-round increased 3.4 percent and 3.3 percent, respectively, between 2017 and2018. • The number of full-time, year-round workers increased by 2.3 million, between 2017 and 2018. The number of men and women full-time, year- round workers increased by about 700,000 and 1.6 million,respectively. Income rounded to nearest$100. Source: U.S. Census Bureau, Current Population Survey, 2018 and 2019 Annual Social and EconomicSupplements. 8
Poverty Rate and Number in Poverty: 1959 to2018 Recession Percent 25 20 Povertyrate 22.4% 15 10 The official poverty rate in 2018 was 11.8 percent, down 0.5 percentage points from 2017. In 2018, there were 38.1 million people in poverty, a decreaseof 1.4 million people from2017. 11.8% 5 0 Numbers inmillions 50 45 40 35 30 25 20 Number inpoverty 38.1 39.5 million million 19591965197019751980198519901995200020052010 2018 Note: The data for 2017 and beyond reflect the implementation of an updated CPS ASEC processing system. The data for 2013 and beyond reflect the implementation of the redesigned incomequestions. Source: U.S. Census Bureau, Current Population Survey, 1960 to 2019 Annual Socialand Economic Supplements. 9
Redesigned Household Income Comparison: 1999 to2018 Income in thousands(2018dollars) Recession 70 65 $63,200 $63,200 $62,700 Adjustedmedian Redesignedmedian Updated 60 processing median Traditionalmedian 55 50 1999 2007 2013 2018 Note: The data for 2017 and beyond reflect the implementation of an updated CPS ASEC processing system. The data for 2013 and beyond reflect the implementation of the redesigned income questions. Income rounded to nearest $100. Source: U.S. Census Bureau, Current Population Survey, 2000 to 2019 Annual Social and Economic Supplements. 10
Real Median Household Income by Race and Hispanic Origin of Householder: 1967 to2018 Income inthousands(2018dollars)Recession 100 90 $87,200 80 Asian $68,300 $70,600 70 $55,500 60 Non-HispanicWhite $51,500 50 Hispanic (anyrace) $41,300 $41,400 40 30 Black $28,500 20 10 0 1967 1975 1980 1985 1990 1995 2000 2005 2010 2013 2018 Note: The data for 2017 and beyond reflect the implementation of an updated CPS ASEC processing system. The data for 2013 and beyond reflect the implementation of the redesigned income questions. Income rounded to nearest$100. Source: U.S. Census Bureau, Current Population Survey, 1968 to 2019 Annual Socialand Economic Supplements. 11
Family Poverty Rates by Type: 1959 to2018 Percent Recession 50 45 40 42.6% Femaleho useholder, nospouse 35 30 24.9% 25 Allfamilies 20 Malehousehol der, nospouse 18.5% 15 12.7% 9.0% 4.7% 10.7% 10 5.3% 5 Marriedcouple 19801985199019952000200520102018 0 1959 1965 1970 1975 Note: The data for 2017 and beyond reflect the implementation of an updated CPS ASEC processing system. The data for 2013 and beyond reflect the implementation of the redesigned income questions. Data for Married Couple Families and Male Householder Families are not available from 1960 to1973. Source: U.S. Census Bureau, Current Population Survey, 1960 to 2019 Annual Socialand Economic Supplements. 12
Highlights • The Supplemental Poverty Measure (SPM) rate in 2018 was 13.1 percent. This is not statistically different from the 2017 SPM rate of 13.0percent. • The SPM rate for 2018 was 1.3 percentage points higher than the official poverty rate of 11.8percent. • There were 16 states plus the District of Columbia for which SPM rates were higher than official poverty rates, 22 states with lower rates, and 12 states for which the differences were not statistically significant. Source: U.S. Census Bureau, Current Population Survey, 2018 and 2019 Annual Social and EconomicSupplements. 13
Official and SPM Thresholds for Units with TwoAdults and TwoChildren Supplemental Poverty Measure Thresholds,2018 Supplemental Poverty Measure Thresholds for Renters,2018 $28,342 $28,166 $25,465 $24,173 Official poverty measure Owners with a mortgage Owners without a mortgage Renters Source: Official Poverty Thresholds, <www.census.gov/data/tables/time-series/demo/income-poverty/historical- poverty-thresholds.html>, Supplemental Poverty Measure Thresholds, Bureau of Labor Statistics(BLS), <https://stats.bls.gov/pir/spmhome.htm>, Geographic adjustments based on housing costs from the American Community Survey2012-2016. 14
Comparison of SPM Poverty Estimates: 2017 and2018 (InPercent) 20172018 14.5 14.2 13.6 13.6 12.5 13.1 13.0 12.4 AllPeople Under18 years 18 to64 years 65 years andolder Source: U.S. Census Bureau, Current Population Survey, 2018 and 2019 Annual Social and EconomicSupplements. 14
Difference in Poverty Rates by State Using the OfficialMeasure and the SPM: 3-Year Average 2016 to2018 1 Includes unrelated individuals under age15. Source: U.S. Census Bureau, Current Population Survey, 2017 to 2019 Annual Social and EconomicSupplements. 16
Change in Number of People in Poverty AfterIncludingEach Element:2018 ndover Source: U.S. Census Bureau, Current Population Survey, 2019 Annual Social and EconomicSupplement. 17
Includes data from the Current Population Survey’s Annual Social and Economic Supplement (CPS ASEC) and the American Community Survey(ACS). • ACS is the recommended source for smaller populations and levels ofgeography. 18
Highlights • The percentage of people without health insurance coverage for the entire calendar year was 8.5 percent, or 27.5 millionpeople. • Between 2017 and 2018, the uninsured rate increased 0.5 percentage points, and the number of uninsured increased by 1.9 millionpeople. • The uninsured rate decreased in 3 states and increased in 8 states between 2017 and 2018. 19
Percentage of People by Type of Health Insurance Coverage:2018 Uninsured 8.5 Uninsured With healthinsurance 91.5 With healthinsurance Any privateplan 67.3 Any PrivatePlan Employment-based 55.1 Employment-based Direct-purchase 10.8 Direct-purchase TRICARE 2.6 TRICARE Any publicplan 34.4 Any PublicPlan 17.8 17.9 Medicare Medicare Medicaid Medicaid VA andCHAMPVA* 1.0 VA andCHAMPVA 20
Changes in the rate of health insurance coveragereflect: • Economictrends • Demographic shifts • Policy changes, such as the Affordable Care Act(ACA) 21
Change in Percentage of People by Type of Health Insurance Coverage: 2017 to2018 Uninsured With healthinsurance Anyprivateplan Employment-based Direct-purchase TRICARE Any publicplan Medicare Medicaid VA andCHAMPVA1 Z Represents or rounds to0 No statistical change betweenyears. *Denotes a statistically significant change between 2017 and 2018 at the 90 percent confidence level. 1Includes CHAMPVA (Civilian Health and Medical Program of the Department of Veterans Affairs), as well as care provided by the Department of Veterans Affairs and themilitary. Source: U.S. Census Bureau, Current Population Survey, 2018 Annual Social and Economic Supplement Bridge File and 2019 Annual Social and EconomicSupplement. 22
Percentage of People Uninsured by Age: 2017 and2018 20 2018 2017 No statisticaldifference 15 No statisticaldifference +1.0 +1.0 10 +0.6 5 No statisticaldifference 0 0-18 19-25 26-34 35-44 45-64 65 andolder Source: U.S. Census Bureau, Current Population Survey, 2018 Annual Social and Economic Supplement Bridge File and 2019 Annual Social and EconomicSupplement. 23
Percentage of Children Under the Age of 19 Without Health Insurance Coverage by Selected Characteristics: 2017 to2018 2018 2017 Total +0.6 Income-to-PovertyRatio Below 100% ofpoverty No statisticaldifference Between 100% and 399% ofpoverty No statisticaldifference At or above 400% ofpoverty +0.7 Race and HispanicOrigin White, notHispanic +0.5 Black No statisticaldifference Asian No statisticaldifference +1.0 Hispanic (anyrace) 0 2 4 6 8 10 *Denotes a statistically significant change between 2017 and 2018 at the 90 percent confidencelevel. Source: U.S. Census Bureau, Current PopulationSurvey, 2018 Annual Social and Economic Supplement Bridge File and 2019 Annual Social and EconomicSupplement. 24
Uninsured Rate by State:2018 : A state with a circle around its abbreviation expanded Medicaid eligibility on or before January 1,2018. Source: U.S. Census Bureau, 2018 American Community Survey, 1-YearEstimates 25
Change in Uninsured Rate: 2017 to2018 : A state with a circle around its abbreviation expanded Medicaid eligibility on or before January 1, 2018. Source: U.S. Census Bureau, 2017 and 2018 American Community Survey, 1-YearEstimates 26 After the release of the 2017 data products, the Census Bureau identified issues with data collection in Delaware. As a result, comparisons between 2017 and 2018 for Delaware are not made in this map. For more information,see <www.census.gov/programs-survey/acs/technical-documentation/errata/120.html>.
Highlights Summary • Median household income was $63,200 in 2018, not statistically different from the 2017median. • The official poverty rate in 2018 was 11.8 percent, down 0.5 percentage points from 2017. In 2018, there were 38.1 million people in poverty, 1.4 million people less than the number in poverty in2017. • The Supplemental Poverty Measure (SPM) rate in 2018 was 13.1 percent. This is not statistically different from the 2017 SPM rate of 13.0 percent. • The percentage of people without health insurance coverage for the entire calendar year was 8.5 percent, a 0.5 percentage-point increase from 2017. In 2018, 27.5 million people did not have health insurance coverage, an increase of 1.9 millionpeople. Income rounded to nearest$100. Source: U.S. Census Bureau, Current Population Survey, 2018 and 2019 Annual Socialand Economic Supplements.
2018 American Community Survey – 1-year Public Release • The 2018 ACS 1-year Detailed Tables, Data Profiles, and Summary File will be released on Thursday, September 26, 2019. • The 2018 ACS 1-year Comparison Profiles, Selected Population Profiles, and Subject Tables will be released on Thursday, October 17, 2019. • The 2018 ACS 1-year Public Use Microdata Sample (PUMS) files will be released on Thursday, November 14, 2019. • The 2018 ACS 1-year Supplemental Estimates will be released on Thursday, February 6, 2020. For more information on the release schedule, visit 2018 ACS Release Schedule. census.gov/programs-surveys/acs/news/data-releases/2018/release
Future ACS DataReleases • The 2014-2018 American Community Survey 5-year estimates will start being released on Thursday, December 19, 2019. These data will be available for all geographic areas including census tracts, ZIP Code Tabulation Areas (ZCTAs), and block groups. • The 2014-2018 ACS 5-year Detailed Tables, Data Profiles, and Summary File will be released on Thursday, December 19, 2019. • The 2014-2018 ACS 5-year Comparison Profiles, Subject Tables, and Narrative Profiles will be released on Thursday, January 16, 2020. • The 2014-2018 ACS 5-year Public Use Microdata Sample (PUMS) files and 2014-2018 ACS 5-year Variance Replicate Estimates will be released on Thursday, January 30, 2020. census.gov/programs-surveys/acs/news/data-releases/2018/release
The American Community Surveydata.census.gov census.gov/data/academy/webinars/2019/transition-data-census 31
The Economic Census (EC) • NAICS: Nearly every 2- thru 6-digit code covered by the Census Bureau • Excludes Agriculture (NAICS 11) and other selected types of business (see https://www.census.gov/programs-surveys/economic-census/guidance/understanding-naics.html#par_textimage for full list of exclusions) • Geography: National, state, metro, county, place, and ZIP Code levels (areas shown vary by sector) • Other Dimensions: Data by business size(establishment and firm; employment and revenue), Legal Form of Organization, Franchisestatus, etc. • Over 200 data variables shown, including number of establishments, employment, payroll and “sales” plus sector-specific variables (inventories, assets, expenses, etc.) • Product Lines data (revenue by products sold or manufactured or services provided) (Note: Also have programs related to the EC, including the Economic Census of Island Areas, the Survey of Business Owners and the Commodity Flow Survey)
See the release schedule on the Economic Census web site (https://www.census.gov/programs-surveys/economic-census/about/release-schedules.html) for updates (Includes the Economic Census of Island Areas releases too)
Census vs. Economic Geographies • Include Legal Areas and Statistical Areas • Unique ECON Geographic Areas: • ZIP Codes (vs. ZIP Code Tabulation Areas (ZCTAs)) • Economic Places (2,500+ pop/jobs) • CFS Areas (not on chart – a subset of metros plus Remainders) • Consolidated cities (also not on chart) • Notes: • Most ECON program geographies are baselined back to prior (latest) Economic Census • Businesses geocoded based on their physical address
Geographic Area Changes for 2017 EC • 15 states had metro areas (CBSAs) with some type of change • 3 states had counties with some type of change • Alaska, South Dakota, and Virginia • Every state had economic place changes (16,349 Places and parts; 58% changed) • 4,891 Places with Area Gain • 3,976 Places with Area Loss • 125 Places where their code and/or name changed • 442 New Economic Places • 171 Dropped Economic Places • Island Areas • No metro changes for Puerto Rico, no county- or place-equivalent changes for any of the other 4 island areas (U.S. Territories) Visit https://www.census.gov/programs-surveys/economic-census/geographies.html for more information
See https://www.census.gov/programs-surveys/economic-census/geographies/change-notes.html
Other Changes for 2017 (cont.) • New Disclosure Rules (and their impacts) • Historically, Number of Establishments was not suppressed even when other variables are withheld • New IRS privacy rules require us to suppress Establishment counts when < 3 and/or when other data variables suppressed • Will also be providing more information on measures of reliability
Other Changes for 2017 (cont.) • NAICS and Geographic levels published in Geographic Area tables • For 2012 EC, data released varied by sector • For 2017 EC, no Place data for Manufacturing • No ZIP data for any sector • Published levels for other sectors may be reduced based on response rates, data quality, suppression rules, and other factors • Check the Economic Census web site for more info • Economic Census of Island Areas • Releases will mirror the U.S. data tables as much as possible (consolidated) • 2 Geographic Area Series tables • 4 NAPCS tables and 4 Size tables • 22 Industry tables (Manufacturing and Construction) • 13 Miscellaneous Subjects tables
Other Changes for 2017 • “Structural” Product Changes • New “First Look” release • For 2012 EC, “Advance Report” had 2-digit NAICS national level only; Industry Series reports added selected 2- thru 6-digits • For 2017 EC: Still National data only but with 2- thru selected lower level NAICS detail • “First Look” will be superseded by U.S. data in Geographic Area Statistics • Establishment & Firm Size releases • Consolidated into 7 tables (separate tables by sector in 2012) • Size categories standardized across sectors
Other Changes for 2017 (cont.) • “Structural” Product Changes (cont.) • Adjustments to Miscellaneous Subjects tables • 38 tables dropped • 2 Mining, 4 Construction, 4 Manufacturing, 1 Trans. & Warehousing, 2 Information, 4 Finance & Insurance, 5 Real Estate, 6 Prof/Sci/Tech, 2 Management, 2 Admin, 2 Healthcare, 2 Accommodations, 2 Other Services • 7 tables added • 1 Utilities (“Cost of Purchased Gas for Resale by Utilities”) • 1 Construction (“Location of Const: Employment Size”) • 1 Wholesale Trade (Petroleum) • 1 Educational Services (“Modes of Instruction”) • 1 Healthcare (“New Patient Care Revenue by Payer”) • 2 Accommodation (“Electronic Menu Ordering” and Limited/Full/Luxury Hotel”) • Class of Customer, Enterprise Support, and Exported Services no longer separate releases by sector See the Economic Census web site (https://www.census.gov/programs-surveys/economic-census.html ) for more information
Other Changes for 2017 (cont.) • New Data.census.gov dissemination platform • For the 2012 EC, data primarily released on American FactFinder (AFF), with selected data released in other tools • For the 2017 EC, all data will be released on the new data.census.gov platform (selected data will continue to be released in other tools too) • Historical Economic Census data will be accessible on AFF until eventually migrated to new platform • Users should familiarize themselves with this new tool and its capabilities
Guiding Principles • Easy to use • Customer focused • Provide access to Census data and more • USDA & third party • Leverage existing Census investments • Esri, API • Use latest technology • Cloud • Provide for free Census Business Builder V.2.6 Is HERE! CBB Home Page https://www.census.gov/data/data-tools/cbb.html
Census Business Builder 2.6 Update • Census Business Builder (CBB) version 2.6 now includes up-to-date employment data from the Bureau of Labor Statistics (BLS). Both the Small Business Edition (SBE) and the Regional Analyst Edition (RAE) of CBB will now feature data on employment and wages from the Quarterly Census of Employment and Wages for the nation, states and counties. This update provides timely data to help business owners compare quarterly employment rates and weekly wages, and learn how their business compares to other businesses like them. • Along with new data from BLS, updated 2018 Building Permits, labor force data from the Quarterly Workforce Indicators (QWI), and consumer spending data are available. Additional updates to the tools include: • New employment size and receipts size breakouts from County Business Patterns and Nonemployer Statistics (for both SBE and RAE). • New data on labor force by worker age from the QWI (for both SBE and RAE). • For the RAE, there are new drawing tools to simplify selecting areas of interest for a region and direct links to the Region Part Reports from the summary report. • Also for RAE, data are now available at the two- and three-digit North American Industry Classification System (NAICS) basis. https://www.census.gov/data/data-tools/cbb.How_Tos.html
Census.gov/Academy: Visit and Subscribe • Receive our Data Gems. • These short “how-to” videos are an easy and quick way to increase your knowledge of Census data. Get them in your inbox! • Get access to our data courses. • You will learn-at-your-own-pace with these video-tutorials designed for different skill levels. • Interact with our instructors via webinars. • Learn about our data releases and tools while attending these live virtual classes. • Bring our data experts to you. • Request free workshops and webinars for your organization: census.askdata@census.gov • Take part in this community • Share your feedback and ideas for our educational content: Census.academy@census.gov
Additional Data Tools & Resources Selected Ways to Access Data • American FactFinder • Application Programming Interface (API) • Census Business Builder • Census Engagement Navigator • Data Profiles • Infographics • My Congressional District • My Tribal Area • Narrative Profiles • QuickFacts • Response Outreach Area Mapper census.gov/data/data-tools.html
Stay Current NEWSROOM DIRECTOR’S BLOG This blog gives the director's point of view on everything from Census Bureau news to how we measure America's people, places and economy. census.gov/newsroom/blogs/director.html The latest news releases and statements from the U.S. Census Bureau. Also, find upcoming events, and useful information for mediacensus.gov/newsroom.html AMERICA COUNTS STATS FOR STORIES Featured stories on various topics such as families, housing, employment, business, education, the economy, emergency preparedness, and populationcensus.gov/AmericaCounts Provides links to timely story ideas highlighting the Census Bureau's newsworthy statistics that relate to current events, observances, holidays, and anniversaries census.gov/newsroom/stories.html census.gov/newsroom/facts-for-features.html
Stay Connected #CensusData Signup forand managealertsat https://public.govdelivery.com/accounts/USCENSUS/subscriber/new facebook.com/uscensusbureau twitter.com/uscensusbureau youtube.com/user/uscensusbureauinstagram.com/uscensusbureau Moreinformationon the AmericanCommunitySurvey: https://www.census.gov/acs Census(Non-mediainquiries) 800-923-8282 Public InformationOffice (Media) 301-763-3030 pinterest.com/uscensusbureau linkedin.com/company/us-census-bureau