Download

1 / 9
100 likes | 501 Views
Course Project . Simulation of the Slotted Aloha Protocol. Esa Alghonaim COE543 , 2003-2. Simulation flow. Reference results (The analytical equations & curves). Simulation Results & Graphs. Conclusion. Iteration > Max_Iter. Simulation flow. (programmed using Delphi).

E N D
Course Project Simulation of the Slotted Aloha Protocol Esa Alghonaim COE543 , 2003-2
Simulation flow. • Reference results (The analytical equations & curves). • Simulation Results & Graphs. • Conclusion
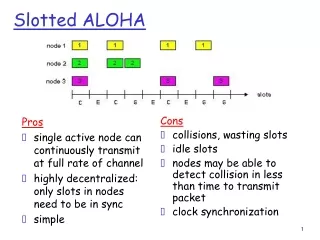
Iteration > Max_Iter Simulation flow.(programmed using Delphi) Start Simulation Slot = 0 , Iteration = 0 , Tot_delay = 0 , Tot_attempts = 0 , Tot_succ = 0 Schedule time Arrival for each terminal No inc Iteration Slot = Minimum arrival/retransmit time for terminals. N = Number of terminals that has arrival/retransmit time = Slot Yes G = Tot_attempts / Slot S = Tot_succ / Slot Delay = Tot_Delay Schedule new arrival time for the terminal No Yes N > 1 Successful Slot Collision Slot inc Tot_attempts inc Tot_succ Tot_Delay = Tot_Delay + (Slot-Arrival) Schedule new arrival time for the terminal Tot_attempts = Tot_attempts + N Assign a random Backlog time for the N colliding packets. If first collision for a packet, schedule new arrival time for the terminal. Stop Simulation
Analytical Results, S vs. G Throughput Offered Load BackLog Constant Probability of successful transmission / new packet Probability of successful transmission / retransmitted packet Average Number of retransmission cycles
Analytical Results, S vs. G Using the symbolic toolbox in the Matlab to generate equations and solve them for different values of G & K.
Analytical Results, Delay vs. S a: normalized delay r: collision detection slot
Simulation Results, S vs. G Fig.1 Analytical and Simulation results for Throughput (S) vs. Offered Traffic (G).
Simulation Results, Delay vs. S Fig.2 Analytical and Simulation results for Delay vs. Offered Traffic.
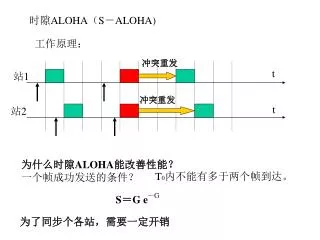
Conclusion • Analytical and simulation results are very near to each other • Both analytical and simulation results indicate that there is an optimum point where the value of the throughput (S) becomes maximum, equal to 0.36 • Increasing the offered traffic beyond this value, both Throughput and Delay becomes worse.