Download

1 / 24
240 likes | 551 Views
Facing Facts 2008 Public Forum. Santee-Lynches Regional COG Thursday, Nov. 19, 2009. Adult Population. Educational Attainment and Earnings Potential. Average Educational Career annual earnings attainment earnings (40 years)

E N D
Facing Facts 2008Public Forum Santee-Lynches Regional COG Thursday, Nov. 19, 2009
Educational Attainment and Earnings Potential Average Educational Career annual earningsattainmentearnings (40 years) $16,121/yr No High School Diploma / GED $644,840 Oct. ‘09 U.S. Unemployment Rate: 15.5% $24,572/yr High School Diploma / GED $982,880 $32,152/yr Associate Degree $1,286,080 Oct. ‘09 U.S. Unemployment Rate: 9.0% $45,678/yr Bachelor Degree $1,827,120 $55,641/yr Master Degree $2,225,640 $86,833/yr Doctorate Degree $3,473,320 Source: U.S. Census 2000
Impact of More Education / Postsecondary (Data available for Sumter, Kershaw & Clarendon counties) Educational Median annual Total Annual aggregate attainment* personal earnings (+) Adults (25+) earnings (+) Current $26,971 126,579 $3,413,962,859 Good gains (2%) $27,414 (+$443) 126,579 $3,470,084,678 (+$56M) Great gains (4%) $27,797 (+$826) 126,579 $3,518,458,920 (+$105M) • Educational attainment is the composition of adults 25-and-older in 4 categories: • Less Than a High School Diploma/GED, only a High School Diploma/GED, • Some college or Associate Degree only, and Bachelor Degree or more. Source: United Way of America, Common Good Forecaster, 2007 data
Public high school graduation rates and post-secondary rates in region About 70% of 8th graders are graduating high school with a diploma over time in region. Almost 50% of 8th graders are entering post-secondary education directly after high school 8th graders • Current region graduation rate average of an estimated 70% is about equal to state average.(U.S. average is about 75% in recent years.) • Percentage of region’s students entering post-secondary directly after high school (estimated nearly 50%) is a few percent below the state average. Source: S.C. Department of Education enrollment and diploma data for high school graduating cohorts of 2004-’05 through 2007-’08
Source: U.S. Census Bureau * Lee total is Census 2000
Source: U.S. Census Bureau * Lee total is Census 2000
Source: S.C. Department of Education, 2008 PACT English scores, 6th-8th graders meeting standards
Public high school graduation rates and post-secondary rates in region About 70% of 8th graders are graduating high school with a diploma over time in region. Almost 50% of 8th graders are entering post-secondary education directly after high school 8th graders • Current region graduation rate average of an estimated 70% is about equal to state average.(U.S. average is about 75% in recent years.) • Percentage of region’s students entering post-secondary directly after high school (estimated nearly 50%) is a few percent below the state average. Source: S.C. Department of Education enrollment and diploma data for high school graduating cohorts of 2004-’05 through 2007-’08
Source: S.C. Department of Education 8th and 12th grade enrollment data by cohort for graduating classes of 2002-’03, 2003-’04, and 2006-’07.
Early-Early Childhood Education 0-3 years
Human Brain DevelopmentSynapse Formation Dependent on Early Experiences Language Higher Cognitive Function Sensory Pathways (Vision, Hearing) FIRST YEAR -8 -7 -6 -5 -4 -3 -2 -1 1 2 3 4 5 6 7 8 9 10 11 1 2 3 4 5 6 7 8 9 10 11 12 13 14 15 16 17 18 19 Birth (Months) (Years) Source: C. Nelson (2000)
Literacy – Early Vocabulary Growth 1200 College-educated parents Working-class parents Cumulative Vocabulary 600 Welfare parents 0 12 16 20 24 28 32 36 Age - Months B. Hart & T. Risley, Meaningful Differences in Everyday Experiences of Young American Children, 1995
Socio-economic class differences in children’s intellectual growth TopicCollege-educated Working- Welfare parentsclass parentsparents Vocabulary at age 3 1,116 words 749 words 525 words Average I.Q. at age 3 117 107 79 Parental “utterances” per hour at age 3 487 301 176 Total encouragements/ discouragements heard by age 3 498,000/78,000 186,000/108,000 78,000/171,000 (6-to-1) (2-to-1) (1-to-2) Summary: Children’s language exposure that includes more affirmations and complex sentences correlates strongly with I.Q. and academic success later on in life. Source: Hart and Risley, Meaningful differences in the everyday experiences of young American children, 1995
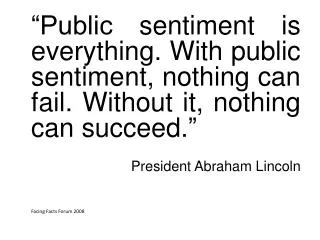
Socio-economic class differences in children’s intellectual growth “Taken together, the conclusions of these researchers (Hart & Risley, Brooks-Gunn, Farah, and Lareau) suggests that the disadvantages that poverty imposes on children aren’t primarily about material goods. True, every poor child would benefit from having more books in his home and more nutritious food to eat. But thereal advantages that middle-class children gain come from more elusive processes: the language that their parents use, the attitudes toward life that they convey.” Source: Paul Tough, The New York Times Magazine, 2006
Risk factors contributing to readiness gaps #1 Disability:Primarily speech and language disorders, but also mental, emotional, vision, hearing and learning disabilities. (Cause: Mostly Genetic, Partly Environmental) #2 Emotional/Behavioral Problems:Lack all the following on standardized measurement in Kindergarten: Self-control, social problem-solving, interaction with others, and self-concept. (Cause: Mostly Environmental, Partly Genetic) #3 Low Literacy Skills:Low vocabulary, language skills and literacy experiences developed primarily at home with family. A direct result generally of a mother without a diploma/GED. (Cause: All environmental) #4 Poor:On Free Lunch (under 130% of poverty) Source: S.C. Kids Count 2009
For every 10 kids in S.C. Number in Top-3 risk factors (Disability, Emotional/Behavioral Problems, Low Literacy Skills) Number not having Top-3 risk factors (Disability, Emotional/Behavioral Problems, Low Literacy Skills) 4 2.1 1.3 6 1.3 0.5 Below Basic in 5th Grade on PACT Below Basic in 5th Grade on PACT Far Below Basic in 5th Grade on PACT Far Below Basic in 5th Grade on PACT Source: S.C. Kids Count 2009
S.C. Dept. of Juvenile Justice Juvenile Profile 950 juveniles in residence At Admission • Teenage juveniles’ assessed reading and math skills are generally at least three grade levels behind their peers. Many qualify for special education classes. • DJJ School District operates 12 months a year offering middle school and high school programs to educate juveniles. Source: S.C. Department of Juvenile Justice
S.C. Dept. of Corrections Inmate Profile 24,462 inmates – June 30, 2009 At Admission (Intake) • Average is 8.5 grade reading level (assessment) • 53% read at less than 9th grade level (assessment) • 58% don’t have a high school diploma or GED (self-reported) • 10.5 grade is average educational achievement level (self-reported) Source: S.C. Department of Corrections
WEIGHING THE COSTSINCARCERATION - VERSUS - EDUCATION 1 Student educated in state $25.39/day $9,268/year 1 Adult Inmate 1 Juvenile 1 Student incarcerated incarcerated in state in state In State $44.98/day $300/day $22.35/day $16,462/year $109,500/year $8,159/year THE DIFFERENCES Adult Inmate/StudentJuvenile/Student Cost per day nearly double Cost per day more than (1.77 times as expensive) 11 times as expensive Sources: Fiscal 2008 current operational expenses from S.C. Department of Corrections, S.C. Department of Juvenile Justice, and S.C. Department of Education
Facing Facts 2008 Reports and Tonight’s Presentation are Available for Download on ourCOG Web site: www.santeelynchescog.org