Download
1 / 18
180 likes | 325 Views
Sustainable intensification of maize-legume-livestock integrated farming systems in Eastern and Southern Africa IITA-Dar es Salaam, Tanzania, 6-9 Feb 2012. M&E Goals, Implementation Strategy, and Data & Analysis Platform. Carlo Azzarri, Melanie Bacou, Ali Bittinger (UMN), Zhe Guo,

E N D
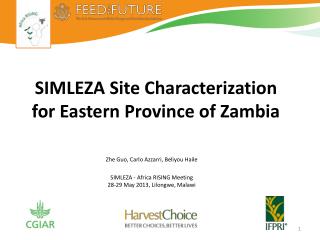
Sustainable intensification of maize-legume-livestock integrated farming systems in Eastern and Southern Africa IITA-Dar es Salaam, Tanzania, 6-9 Feb 2012 M&E Goals, Implementation Strategy, and Data & Analysis Platform Carlo Azzarri, Melanie Bacou, Ali Bittinger (UMN), Zhe Guo, Dave Hodson (CIMMYT), Jawoo Koo, An Notenbaert (ILRI), Ria Tenorio, Pierre Sibiry Traore (ICRISAT), Stanley Wood
M&E Guiding Principles • FtF Compliance:Conform to the FtF core indicators • Multi-scale, Multi-site reporting: Meet broad stakeholder needs and support multi-scale/multi-site M&E through; • Action-site, sub-system and system reporting • Country reports:Breakout of site reports to serve national stakeholder needs • Regional Site-reports: for each of the three regional SI program sites • SSA-reports: cross-system reporting and SI-wide “roll-up” of indicators across: Sudano-Sahelianzone, Ethiopian Highlands, Eastern and Southern Africa • Monitoring & projection:Provide monitoring reports andshort-term projections (targets) of key M&E indicators for intervention sites in project “Zone of Influence”, updated annually • Scaling indicators up and out (spatial & temporal): Use a range of biophysical, bio-economic , market and welfare models for ex ante analysis of output, outcome, and impact indicators. • Keywords: extrapolation, aggregation, tradeoffs, spillover potential, sustainability, welfare and environmental goals • Open-access data and analysis platform: Maintain a transparent, open-access M&E data management and analysis platform to serve the needs of SI stakeholders
Key Activities for M&E • Stocktaking: Inventory (and mapping) of partner sites and SI component innovations. Characterization of sites & innovations • Stratification and diagnosis of target systems/geographies: Highlight key differences in initial conditions, drivers of change, and SI-related constraints or opportunities • Identification of potential sites: That are representative of the identified stratification and cost-effective for implementation. • Map proposed activities and outcomes into M&E indicators. • Design & conduct baseline and periodic surveys: Using secondary data sources where possible (e.g. NSO/MoA, DHS, LSMS, CRP surveys) • Maintaining an Innovation Inventory: To enable discovery and delivery of innovation options project-wide. • Establish a Linked Model/Evaluation capacity: To support M&E reporting cycleof outcome and impact indicators (e.g., up/out-scaling and projections with and w/o SI interventions) • Impact/Attribution assessment: To the standards required (ex post studies)
Project Assumptions, Outcomes, Impacts, & FtF Indicators OUTCOMES CAADP ASSUMPTIONS 1 2 Stable/Re-generating environment Available /Adaptable Innovation Components More efficient, productive, & resilient production systems I Significant SI gains from systems-focused component integration Increased food, feed, fodder More effective use of land, water, biod’vrsty resources Innovative & tractable implementation models can be applied 1 II 1 Poverty Women Empowered Greater, more equitable returns to hhlabour and assets 1 1 Delivery mechanisms integral to project design and implementation Income 4 III AL IGNED Improved household nutrition (esp W&C) Hunger/Nutrition Willing, capable, relevant partners/users engaged Prices Better served and more efficient value chains Sector Growth IV Quick wins/lessons are feasible, focus long-term 1 Increased value-added, jobs & trade Aware, engaged, empowered, farmers & service providers 9 1 Scaling up/out and maximising spillovers are part of project design 3 Improved research methods, partnership and delivery models M&E
Potential Stratification and Experimental Design Framework* • Foresighting activity. Stakeholder vision of 15-20 year outcomes for target systems and geographies • Geographic (problem/intervention domain) stratification. Identifying problem domains that reflect key differences in initial conditions (status and trends) and drivers of change. * Sustainable Intensification Hypothesis Group, Addis Meeting
Geographic Stratification of Target Systems/Areas Source: Site Selection Group. Addis SI Workshop, Feb 2012
Potential Stratification and Experimental Design Framework* • Foresighting activity. Stakeholder vision of 15-20 year outcomes for target systems and geographies • Geographic (problem/intervention domain) stratification. Identifying problem domains that reflect key differences in initial conditions (status and trends) and drivers of change. • Site-specific (farm/landscape) stratification. Sustainability and Intensification stratification within each geographic domain • Articulate & test potential SI trajectories within geographic and site-specific strata * Sustainable Intensification Hypothesis Group, Addis Meeting
Stratification & SI Trajectories Farm/Landscape Stratification Geographic Stratification Hi-Lo Hi-Lo Hi-Hi Hi-Hi Rainfed Ag. Potential Intensification Index Lo-Lo Lo-Lo Lo-Hi Lo-Hi Sustainability Index Market Potential Pop. density * Sustainable Intensification Hypothesis Group, Addis Meeting
Prototype Intensification Index Source: Based on Agricultural Sample Enumeration 2001-2
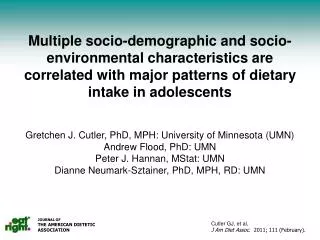
Farm-Scale Crop Enterprises (Tanzania) Source: Based on Tanzania Agricultural Census 2007-08 (based on minimum land area allocation or 0.02ha per crop)
Hunger, Poverty & Productivity Spatial Covariates/Proxies & Analytical Flow Terrain, Demography, Infrastructure, Admin Units Production Environment & Constraints Production Systems & Performance Linkage to Macro Models Interventions/ Responses Crop Distribution & Yields Settlements, ports, markets Crop Suitability: Rainfed Wheat Agroecological Zones Port travel times & costs Market travel times & costs Slope, aspect, drainage Road, rail, river, ICT networks Elevation Administrative Units Yield Responses to Inputs, Management, CC Drought Incidence & Severity Runoff Pests & Diseases (Maize Stem Borer) Cropland extent & intensity Farming Systems Value of Production per Rural Person Profitability of small scale irrigation Quantity of Nutrients Removed Aggregate to FPUs Fertilizer Profitability Distribution of Welfare Benefits Source: HarvestChoice/IFPRI 2010
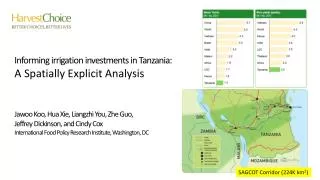
Mean Yield (kg/ha) 4000 2. Yield responses to fertilizer 1. Agro-climatic suitability Variety: Digelu Variety: Veery No Fertilizer No fert. Kenya Ethiopia 100% Rec. Fert. Recommended Fertilizer Rate No fert. 100% Rec. Fert. RAINFED WHEAT Transport cost: Port to Farm-gate Wheat farming enterprise data Yield Yield 3. Modeling of farm-gate prices 4. Profitability analysis Transport cost: Capital to Farm-gate International wheat and fertilizer prices Profitability Sensitivity Analysis Tool (Excel) Net Economic Return and Potential Production Source: CIMMYT – HarvestChoice/IFPRI “Wheat Potential for Africa “ (2011 draft)
Maize-Legume Analytical Tools Source: HarvestChoice/IFPRI Prototype SIMLESA simulations (2010)
M&E Implementation to date • Target area stratification and site selection • Establishing core FtF M&E obligations • Recruiting an M&E Coordinator • Building an M&E implementation community (especially with national and local partners) • Designing an open-access, web-based M&E data and analysis platform • Planning annual M&E technical meetings
West Africa: Year 1 M&E Timeline Component Inventory Target Area Characterization/ Site selection Component DB Map Activities-> M&E Indicators Program M&E Plan Survey Design Baseline Surveys Potential Impact Evaluation: Scaling Out & Projection ✔ 1-3 Months 3-9 Months 9-12 Months
Site/Station (& R&D) Inventory • Station Location (if known, Lat:___ Long: ___) • Location Name: ________________________________ • District: _____________ Region: __________________ • Site/Station Full Name: ______________________ • Institution: ________________________________ • Technologies/Practices tested/demonstrated • Contact details
Issues/Questions • What is the appropriate split of M&E roles between the M & the E? (e.g., strong interest in early assessments of outcomes and spillover potential) • What is the likely cost of meeting donor’s minimum reporting needs? • How to ensure CAADP alignment (e.g. components selected on basis of elicited demand or available supply?) • What are Site Implementation VS Program wide M&E needs/roles? e.g., IITA-lead Tanzania “M&E” plans VS IFPRI-lead SSA M&E e.g., How will “Tanzania efforts” efforts be coordinated? Who should program M&E be in dialog with? • Establishing shared roles in data and tool development, access and application across program partners and stakeholders e.g. obtaining appropriate cross-fertilization in site selection, field data collection, annual reporting/analysis? • What interest in engaging actively in a program M&E community (especially from national partners)? • Who are likely candidates for M&E Coordinator position?