Download
1 / 65
650 likes | 770 Views
Chapter 23. The Evolution of Populations. Western Historical Context. Gregor Mendel (1822-1884). Austrian monk whose breeding experiments with peas shed light on the rules of inheritance. Mendel was a contem- porary of Darwin, but his work was overlooked until the 20 th century.

E N D
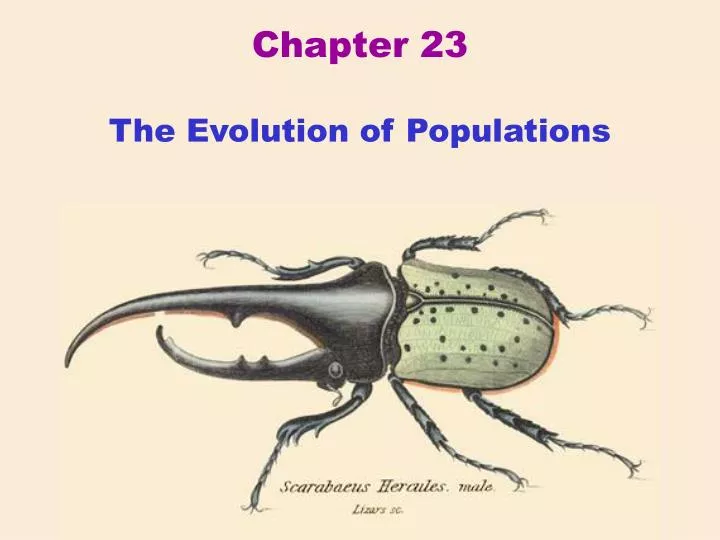
Chapter 23 The Evolution of Populations
Western Historical Context Gregor Mendel (1822-1884) Austrian monk whose breeding experiments with peas shed light on the rules of inheritance Mendel was a contem-porary of Darwin, but his work wasoverlooked until the 20th century
Western Historical Context The Modern Synthesis (early 1940s) A conceptual synthesis of Darwinian evolution, Mendelian inheritance, and modern population genetics
Potential for rapid population growth when resources are not limiting Resource availability generally limits population size Competition for resources (“struggle for existence”) Phenotypic variability (morphology, physiology, behavior, etc.) Natural Selection: Survival and reproduction of the “fittest” individuals Some variabilityresults from heritable genotypic differences
Phenotype vs. Genotype Phenotype: all expressed traits of an organism
Phenotype vs. Genotype Phenotype: all expressed traits of an organism Genotype: the entire genetic makeup of an individual (i.e., its genome – it’s full complement of genes and the two alleles that comprise each locus), or a subset of an individual’s genes
Evolution A change in allele frequency in a population (a change in the gene pool) Population = all of the individuals of a species in a given area
Potential for rapid population growth when resources are not limiting Resource availability generally limits population size Competition for resources (“struggle for existence”) Phenotypic variability (morphology, physiology, behavior, etc.) Natural Selection: Survival and reproduction of the “fittest” individuals Some variabilityresults from heritable genotypic differences Adaptive evolution: A change in the phenotypic constitution of a population owing to selection on heritable variation among phenotypes that changes the genotypic constitution of the population
Population Genetics Examines the frequency, distribution, and inheritance of alleles within a population
Hardy-Weinberg Equilibrium The population genetics theorem that states that the frequencies of alleles and genotypes in a population will remain constant unless acted upon by non-Mendelian processes (i.e., mechanisms of evolution)
See Figs. 23.4 & 23.5 – An example This means that 80% of sperm & eggs will carry R, and 20% of sperm & eggs will carry r
Allele Frequencies Under strict Mendelian inheritance, allele frequencies would remain constant from one generation to the next (Hardy-Weinberg Equilibrium) R 80% (p=0.8) 80% (p=0.8) R Sperm Eggs RR p2=0.64 r 20% (q=0.2) 20% (q=0.2) r rR qp=0.16 Rr pq=0.16 rr q2=0.04 Genotype frequencies: p2=0.64 (RR) 2pq=0.32 (Rr) q2=0.04 (rr) Allele frequencies: p=0.8 (R) q=0.2 (r)
Allele Frequencies At a later date, you determine the genotypes of 500 individuals, and find the following: 280 RR 165 Rr 55 rr Frequency of R (a.k.a. “p”): 280 + 280 + 165 = 725 R alleles in the pop. 725 / 1000 = 0.725 Frequency of r (a.k.a. “q”): 165 + 55 + 55 = 275 r alleles in the pop. 275 / 1000 = 0.275
Allele Frequencies The frequencies of alleles R and r have changed: 280 RR 165 Rr 55 rr 320 RR 160 Rr 20 rr T2: T1: p=0.725, q=0.275 p=0.8, q=0.2 The population has EVOLVED!
Hardy-Weinberg Equation For a two-allele locus: Let p = the frequency of one allele in the population (usually the dominant) Let q = the frequency of the other allele Notice that: p + q = 1 p = 1 – q q = 1 – p Genotypes should occur in the population according to: p2 + 2pq + q2 = 1
Hardy-Weinberg Equation p2 + 2pq + q2 = 1 p2 = proportion of population that is homozygous for the first allele (e.g., RR) 2pq = proportion of population that is heterozygous (e.g., Rr) q2 = proportion of population that is homozygous for the second allele (e.g., rr)
Hardy-Weinberg Equation p2 + 2pq + q2 = 1 Given either p or q, one can solve for the rest of the above equation What wouldqbe ifp = 0.6? What would2pqbe ifp = 0.5?
Hardy-Weinberg Equation p2 + 2pq + q2 = 1 Given the frequency of either homozygous genotype, the rest of the equation can be solved What wouldqbe ifp2 = 0.49? Hint:q=q2
Hardy-Weinberg Equilibrium Is a null model… like Newton’s first law of motion: Every object tends to remain in a state of uniform motion (or stasis), assuming no external force is applied to it The Hardy-Weinberg Equation will be satisfied, as long as all the assumptions are met…
Hardy-Weinberg Equilibrium Assumptions: 1) Infinite population size Because genetic drift affects smaller populations more than larger pops. Genetic drift = allele frequency change due to chance Genetic drift reduces genetic variability
See Fig. 23.7 Genetic drift in a small population of wildflowers
See Fig. 23.7 Genetic drift in a small population of wildflowers
See Fig. 23.7 Genetic drift in a small population of wildflowers
Genetic drift often results from populations passing through a population bottleneck
Genetic drift often results from populations passing through a population bottleneck
The founder effect is an example of a population bottle neck Mainland population
The founder effect is an example of a population bottle neck Colonists from themainland colonize an island Mainland population
The founder effect is an example of a population bottle neck Colonists from themainland colonize an island Island gene poolis not as variable as the mainland’s Mainland population
Hardy-Weinberg Equilibrium Assumptions: 1) Infinite population size (no genetic drift) 2) No gene flow among populations Gene flow = transfer of alleles among populations Emigration transfers alleles out of a population and immigration transfers them in
Gene flow connects populations time Population at t2 (after immigration) Island gene poolis not as variable as the mainland’s Population at t1
Gene flow connects populations Island gene poolis not as variable as the mainland’s Population at t1
Gene flow connects populations time Population at t2 (after immigration) Island gene poolis not as variable as the mainland’s Population at t1
Hardy-Weinberg Equilibrium Assumptions: 1) Infinite population size (no genetic drift) 2) No gene flow among populations 3) No mutations
Mutations generally boost genetic diversity time Population at t2 (after immigration) Island gene poolis not as variable as the mainland’s Population at t1
Mutations generally boost genetic diversity time Population at t2 (after a mutation event) Island gene poolis not as variable as the mainland’s Population at t1
Hardy-Weinberg Equilibrium Assumptions: 1) Infinite population size (no genetic drift) 2) No gene flow among populations 3) No mutations 4) Random mating with respect to genotypes E.g., imagine what would happen if RR males mated only with rr females Those particular matings would result in no RR or rr offspring, thereby altering population-wide genotype frequencies
Hardy-Weinberg Equilibrium Assumptions: 1) Infinite population size (no genetic drift) 2) No gene flow among populations 3) No mutations 4) Random mating with respect to genotypes 5) No natural selection E.g., imagine what would happen if rr flowers were the only ones that ever attracted pollinators (even though the population contains RR and Rr individuals as well)
Hardy-Weinberg Equilibrium Assumptions: 1) Infinite population size (no genetic drift) 2) No gene flow among populations 3) No mutations 4) Random mating with respect to genotypes 5) No natural selection
Variation within Populations Let’s briefly review… Adaptive evolution: A change in the phenotypic constitution of a population owing to selection on heritable variation among phenotypes that changes the genotypic constitution of the population
Variation within Populations Since selection acts on phenotypes, yet evolution requires population-level genotypic change, it is important to understand intraspecific variation Note: If all individuals were phenotypically identical, there would be no opportunity for selection Note: If all individuals were genotypically identical, there would be no opportunity for evolution
Variation within Populations Phenotypic variation results from both environmental and genetic influences Consider identical vs. fraternal twins
Variation within Populations Phenotypic variation results from both environmental and genetic influences Phenotypic variation within populations is either discrete or quantitative/continuous Discrete variation: polymorphism = mutiple phenotypes that are readily placed in distinct categories co-occur (e.g., our red and white flowers result from a polymorphic locus) E.g., a “bar graph” trait like ABO blood type
Variation within Populations Phenotypic variation results from both environmental and genetic influences Phenotypic variation within populations is either discrete or quantitative/continuous Continuous variation: quantitative characters = multiple loci produce a trait (e.g., flower size), and the trait varies continuously in the population E.g., a “bell curve” trait like human height
Variation within Populations Phenotypic variation results from both environmental and genetic influences Phenotypic variation within populations is either discrete or quantitative/continuous Phenotypic variation also exists among populations E.g., geographic variation Heliconius species A Heliconius species B
Variation within Populations How is genetic variation maintained? 1) Diploidy provides heterozygoteprotection 2) Balanced polymorphism Heterozygote advantage E.g., A locus for one chain of hemoglobin in humans has a recessive allele that causes sickle- cell anemia in homozygotes, but provides resistance to malaria in heterozygotes