PROTOCOL FOR DATA VERIFICATION
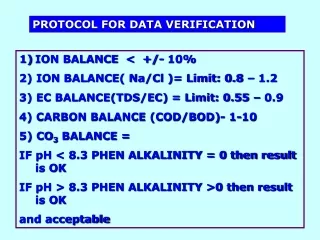
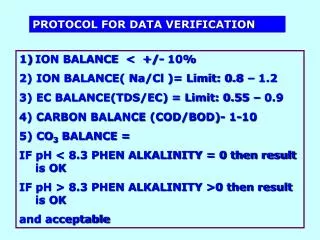
PROTOCOL FOR DATA VERIFICATION. ION BALANCE < +/- 10% 2) ION BALANCE( Na/Cl )= Limit: 0.8 – 1.2 3) EC BALANCE(TDS/EC) = Limit: 0.55 – 0.9 4) CARBON BALANCE (COD/BOD)- 1-10 5) CO 3 BALANCE = IF pH < 8.3 PHEN ALKALINITY = 0 then result is OK

PROTOCOL FOR DATA VERIFICATION
E N D
Presentation Transcript
PROTOCOL FOR DATA VERIFICATION • ION BALANCE < +/- 10% • 2) ION BALANCE( Na/Cl )= Limit: 0.8 – 1.2 • 3) EC BALANCE(TDS/EC) = Limit: 0.55 – 0.9 • 4) CARBON BALANCE (COD/BOD)- 1-10 • 5) CO3 BALANCE = • IF pH < 8.3 PHEN ALKALINITY = 0 then result is OK • IF pH > 8.3 PHEN ALKALINITY >0 then result is OK • and acceptable
DATA VALIDATION- EXAMPLE ION BALANCE • -ION BALANCE RATIO IF > 10 % • THE SAMPLE RESULT CANNOT BE ACCEPTED IF CHECK WAS MADE AT LABORATORY, COULD POSSIBLY RE-ANALYZE SAMPLE REF:-National Workshop on Water Quality Monitoring ---File:DataValid&Analys.doc” --- Version 06-03-00
PRESENT STATUS OF WQ DATA 1) PUNE LAB- NO OF SAMPLES UP TO DEC 2004 = 1245 * Reasons:Sample not re-analysed
PRESENT STATUS OF WQ DATA 1) KOLHAPUR LAB- NO OF SAMPLES UP TO DEC 2004 = 902 * Reasons:Sample not re-analysed
PRESENT STATUS OF WQ DATA 1) NASHIK LAB- NO OF ENTRIES UP TO MARCH 2005 =1584 *VIDE CIRCULAR ISSUED BY SE DCC NASHIK NO.1085 DT.26/06/2003 ONLY 4 RATIOS ARE CONSIDERED HENCE PARAMETERS RELATED TO ION BALANCE ARE NOT ANALISED
PRESENT STATUS OF WQ DATA 1) NAGPUR LAB- NO OF ENTRIES UP TO JAN 2005 =1388 *VIDE CIRCULAR ISSUED BY SE DCC NASHIK NO.1085 DT.26/06/2003 ONLY 4 RATIOS ARE CONSIDERED HENCE PARAMETER RELATED TO ION BALANCE ARE NOT ANALISED **NA/CL – FLAMEPHOTOMETER UNDER REPAIR ***COD/BOD – BOD INCUBATOR UNDER REPAIR
PRESENT STATUS OF WQ DATA 1) AURANGABAD LAB- NO OF ENTRIES UP TO OCT 2004 =335 *VIDE CIRCULAR ISSUED BY SE DCC NASHIK NO.1085 DT.26/06/2003 ONLY 4 RATIOS ARE CONSIDERED HENCE PARAMETER RELATED TO ION BALANCE ARE NOT ANALISED **COD/BOD – BOD INCUBATOR UNDER REPAIR
DATA VALIDATION DATA OUTLIERS DETECTION TEST DATA OUTLIERS DETECTION TEST IS PERFORMED ON THE BASIS OF HISTORICAL DATA AND CURRENT DATA REF-WATER QUALITY ANALYSIS –DESIGN MANUAL-VOL 7,CH 8.2.5 PAGE 138 Various Exercises are performed for detection of outliers
DATA VALIDATION DETECTION OF DATA OUTLIERS Data outliers are extreme (high or low) values that diverge widely from the main body of data set. The presence of one or more outliers may greatly influence any calculated statistics and yield biased results. However, there is also the possibility that the outlier is a legitimate member of the data set. Outlier detection tests are to determine whether there is sufficient statistical evidence to conclude that an observation appears extreme and does not belong to the data set and SHOULD BE REJECTED. Data outliers may result from----, FAULTY INSTRUMENTS,ERROR IN TRANSCRIPTION,MISREADING OF INSTRUMENTS,INCONSISTANT METHODOLOGY OF SAMPLING AND ANALYSIS AND SO ON. These aspects should be investigated and if any of such reasons can be pegged to an outlier , the value may be safely deleted from consideration.
DATA VALIDATION DETECTION OF DATA OUTLIERS Various Exercise are performed for detection of outliers • EXERCISE-1 : Exercise for identification of error during analysis in Laboratory • EXERCISE-2: Data Outliers detection test • On the basis of historical data • EXERCISE-3: Other locations where data is accepted • (Historical Data) • Medium polluted location ,Takali(Nashik),& • 2)Highly polluted location,Manda in Thane district • EXERCISE-4:Inter lab AQC exercise
EXERCISE-1 Table 8.5 : Critical Values for rejection quotient Qexp( reject if Qexp >Q crit) REF-WATER QUALITY ANALYSIS –DESIGN MANUAL-VOL 7,CH 8.2.5 PAGE 138
EXERCISE-1-A DATA OUTLIERS DETECTION TEST Exercise for identification of error during analysis in Laboratory Example 8.9 Concentration measurements for fluoride were measured as 2.77,2.80,2.90,2.92,3.45,3.95,4.44,4.61,5.21,7.46. Use the Q test to examine whether the highest value is an outlier. Solution: Q exp = ( 7.46 – 5.21 ) / ( 7.46 – 2.77 ) = 0.51 Since 0.51 is larger than 0.48.the Q exp value for 96% confidence ,there is a basis for excluding the value. REF-WATER QUALITY ANALYSIS –DESIGN MANUAL-VOL 7,CH 8.2.5 PAGE 138
EXERCISE-1-B Exercise for identification of error during analysis in Laboratory Exercise performed in Nashik Lab for Na & Cl to identify error during analysis and to check the Ratio of Na/Cl. Sample collected from Tap water. Date of analysis : 15/04/2005 Analysis Result: Na = 4.7 ,Cl = 9.02 Ratio of Na/Cl = 0.802 Required Limit : 0.8 – 1.2 Observation: Analysis process is correct and results are ACCEPTED
EXERCISE-2 DATA OUTLIERS DETECTION TEST On the basis of historical data Data Considered for the period of July 97 TO April 2000 of Bund garden Location for the parameters like Na and Cl Which is the CRITICAL RATIO for Pune and Kolhapur Lab
Table-2 Data Entered for Bund garden location BUNDGARDEN LOCATION –NO of Samples-80 For the period of Aug 2000 to Dec2005
EXERCISE-2 Bundgarden – Na – 10 values 1)1.37, 2)0.98 3)0.76, 4)1.08, 5) 1.04, 6) 4.61,7)1.03,8)1.07,9) 1.17, 10)0.78 Qexp = (4.61-1.37) / (4.61-0.76) = 0.84 ( Expected value is >0.48 for 10 observations) Bundgarden – Cl – 10 values 1)1.58, 2)1.41 3)1.02, 4)1.30, 5) 1.55, 6) 4.4,7)1.02,8)0.99, 9) 0.76, 10)0.71 Qexp = (4.40 -1.58) / (4.40 - 0.71) = 0.76 ( Expected value is >0.48 for 10 observations) Conclusion- The values are not in Ratio at Bundgarden location.
EXERCISE-3 DATA OUTLIERS DETECTION TEST OTHER LOCATION WHERE DATA IS ACCECCEPTED( Historical Data) Takali – Na – 3 values (Historical Data)—Polluted Location 1)32.5, 2)47.0 3)18.1, Qexp = (47.0 – 32.5) / (47.0 – 18.1) = 0.58 ( Expected value is <0.98 for 3 observations) Manda – Na – 3 values (Historical Data)Highly Polluted Location 1)1140 , 2)3385 3)3273, Qexp = (3385 – 3273) / (3385 – 1140) = 0.049 ( Expected value is <0.98 for 3 observations) Hence The Data for the above location is ACCEPTED
EXERCISE-4 DATA VALIDATION – AQC EXERCISE • INTER LABORATORY AQC EXERCISE • SAMPLES ARE COLLETED BY PUNE LAB AND SEND TO NAGPUR LAB FOR ANALYSIS TO FIND OUT ERROR IN ANALYSIS. • RESULTS SHOWN IN THE TABLE-1
Table 1: Analysis Result collected from Nagpur Division* ** If pH<8.3 phen’ alkalinity is = 0 ? * The above exercise is performed by Pune Division as directed by SE DAC Nashik vide Lr.No.375 dt.6-5-2004 for verification of above ratios and finding out error in analysis. Observation: It is observed that All values are within the limits. There may be error during analysis in Pune & Kolhapur Lab
OTHER OBSERVATIONS FROM W.Q.DATA BASE PUNE LAB KOLHAPUR LAB In-complete data entry sets
PUNE LAB DATA NOT IN VALIDATION RATIO
PUNE LAB NO DATA
PUNE LAB REMARKS SHOWN ARE NOT PROPER
PUNE LAB NO DATA
PUNE LAB No proper sampling entry-, i.e Preservation not shown properly
Case study of Daund Location (Ref:EE Pune Lr.No.445 Dt.10/03/2004) COD Value is 591.4 , BOD is 6.00 on dated 14/12/2003 ,where as on 25/12/2003 it is 15.2 & 1.8 and on date 24/11/2003 it is 7.7 & 1.8 respectively,which indicate that on dated 14/12/03 the value of COD may be 59.14,required to be verified from the record.
PUNE LAB Values of DO for corresponding dates are 4.00,8.4 & 8.00 shows the data entry mistake.
PUNE LAB Corresponding Ratios of Carbon Balance is 4.27,98.57 & 8.44 clearly shows the data entry mistakes.
Kolhapur Lab Coliforms sampling – Recommended Quantity is 500ml
Kolhapur Lab No proper sampling entry-, i.e Sample for DO is not taken
Kolhapur Lab No proper sampling entry-, How DO Sampler is used for Coliforms?
Kolhapur Lab Depth of Sample collection is not shown
Kolhapur Lab No proper sample entry.What is Freezing?
Kolhapur Lab How Coliforms sample acidified and collected by using DO Sampler?
Kolhapur Lab Validation ratios are not properly verified
Kolhapur Lab Validation ratios are not properly verified and remarks shown are not proper
Kolhapur Lab NO DATA
Kolhapur Lab NO DATA FOR SHIRSINGI LOCATION
DATA VALIDATION- SOFTWARE THE DATA FLOW -HP DEVELOPED SOFTWARE FOR WATER QUALITY,SIMILAR TO QUANTITY -ANLYTICAL RESULTS AND FIELD MEASUREMENTS ENTERED IN TO DATA BASE -DATA BASE SOFTWARE MAKES DATA VALIDATION CHECKS -NOT VALIDATED DATA IS FLAGGED,SHOULD BE CHECKED AND REANALYZED ONLY VALIDATED DATA WILL BE TRANSFERRED TO THE REGIONAL DATA CENTRE ( THIS IS THE DATA FLOW) REF:-National Workshop on Water Quality Monitoring ---File:DataValid&Analys.doc” --- Version 06-03-00
4)Explanation for continuous monitoring of Baseline locations 5)Entry of sample collection as per prescribed methods 6)Entry of number of parameter with respect to validation ratios are mentioned in circular issued by SE DCC Nashik on dated 26/06/2003