Download
1 / 57
570 likes | 724 Views
The Benefits of a Notification Process in Addressing the Worsening Computer Virus Problem. Mike O’Leary Director, Applied Mathematics Laboratory Towson University. Abstract. We used epidemiological models to analyze how behavior affects the spread of a computer virus.

E N D
The Benefits of a Notification Process in Addressing the Worsening Computer Virus Problem Mike O’Leary Director, Applied Mathematics Laboratory Towson University
Abstract • We used epidemiological models to analyze how behavior affects the spread of a computer virus. • In particular, we created a simulation to model a corporate computer network. • Parameters for the simulation were obtained from a survey. • The results of the simulation were compared to a simple analytic model. • These showed the benefit of a well-defined process for notification in preventing the spread of viruses.
Conclusion • Instituting a formal process that notifies the sender of a virus as well as the network administrator is effective in reducing the spread of computer viruses. • This may be more cost-effective than other technological mitigation techniques.
Project Origins • This project is a result of a collaboration between two local companies- Science Applications International Corporation and Science Communications Studies with the Towson University Applied Mathematics Laboratory.
The Applied Mathematics Laboratory • Founded in 1980. • Searches for mathematical research projects at the advanced undergraduate level. • Projects are sponsored by local companies and government agencies. • We charge a fee to cover our costs.
The Applied Mathematics Laboratory • Two faculty members act as project directors. • Three to six students are chosen by invitation to participate in each project. • Projects usually last one full year.
The Applied Mathematics Laboratory • At the end of the Fall Semester, an interim report and an interim presentation are made by the students to the sponsoring organization. • A final report and final presentation are made by the students at the end of the Spring Semester.
Project Collaborators • Joan L. Aron, Science Communication Studies • Ron Gove, Science Applications International Corporation (SAIC) • Shiva Azadegan, Department of Computer & Information Science, Towson University • M. Cristina Schneider
Student Team • Shadi Alagheband • Michael R. Connelly • Sarah Faris • Michael Thomas
Contributors • John McKnight • Myron Cramer • Cedric Armstrong • Jim Frazer • Department of Defense
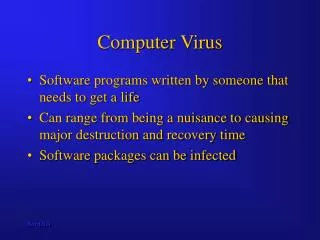
What is a Virus? • A virus is a piece of computer code that is designed to enter another user’s computer, and execute without that user’s permission.
Types of Viruses • Macro viruses • Word • Excel • Access • Executable viruses • Boot sector viruses
Worms • A worm is a virus that can self-propagate
How Do We Stop Viruses? • Anti-virus software • On workstations • On email servers • On network servers • Anti-virus software compares unknown files with a collection of virus signatures. • If there is a match, the software concludes that the file is infected.
Technical Details • Virus signature files must be updated regularly • In many cases, this process is now automated. • Anti-virus software companies are interested in technological solutions • They use the analogy of a “vaccine” against computer viruses.
Lessons From Epidemiology • There are diseases which remain problematic despite effective treatments and/or vaccines. Why? • Behavior • Environment • Host factors
Problems With Total Reliance on Technology • Problems in deployment. • Improper installation. • Improper configuration. • Maintenance. • Windows of vulnerability. • Re-install. • Rapid growth. • Change in IT personnel. • Undetectable viruses. • Melissa et.al.
Example • Failure to update anti-virus signatures on our campus
Virus Survey • Conducted a Computer Virus Epidemiology Survey (CVES) to • Examine indicators of the impact of computer viruses • Provide reasonable ranges for parameters in the simulation model
Virus Survey • A WWW survey • Online from June 1998 to September 1999 • Advertised • by links in search engines • by links in security web sites • by direct email • 106 respondents • Obvious sources of bias
Questions • Organizational characteristics • Severity index • Effects of computer viruses in the preceding 12 months • Anti-virus posture • Number of machines running anti-virus software • Virus signature update procedure
Language • Simulation language was MODSIM • An object-oriented discrete time simulation language • Simulation governed by a continuous time variable • Actions can be scheduled on the basis of the simulation time
Sample Code FOR I := 1 TO Recipients IF (ASK RandomCommChecked UniformReal(0.0, 1.0)) <ProbabilityCommChecked TELL Network[Listener[I]] TO SetStatus(ComputerSender,MethodOfComm,FileTransfer,IntegerInfectionRep); ELSE WaitTime:= ASK RandomWaitTime Exponential (AvgDelayToRespond); IF (WaitTime + SimTime()) > (FLOAT(Days) * 8.0 ) WaitTime := (FLOAT(Days * 8) - SimTime()); END IF; TELL Network[Listener[I]] TO SetStatus(ComputerSender,MethodOfComm,FileTransfer,IntegerInfectionRep) IN WaitTime; END IF; END FOR;
Parameters • Based on the survey results, we examined 11 factors that we thought would have a significant role in the transmission of a virus
Parameters • Probability of effective anti-virus use • Probability of • Email use • Network connection use • Floppy use • Probability that users would share a computer • Cleanup probabilities
Parameters • Notification Probabilities • Detection Probabilities • Exposure Probabilities • Re-Infection Probabilities (Lingering) • Scrub Threshold
Parameter Selection • For each parameter, a base, low, and high value was set. • Representative values were determined from survey parameters or extant literature • A sequence of simulations were run, two for each parameter, which had that parameter at a high or low value, with the other parameters kept at their base value
Parameter Selection • Based on these results, we focused our attention on the following: • Probability that a user had effective anti-virus software [AV] • Communication Rate [Comm] • Exposure Rate [Exposure] • Notification Probability [Notify]
Parameters- Basic • Simulation length (365) • Number of computers (200)
Parameters- Viruses • Number of distinct virus types (20) • Word macro viruses (76%) • Excel macro viruses (5%) • Boot sector viruses (2%) • Executable viruses (17%) • Frequencies taken from WildList, August 1998.
Parameters- Communication • Number of communication events per day (100, 200, 400, 1000) [Comm] • Methods • Email (75%) • Network connection (20%) • Floppy disk (5%) • Data • Word documents (70%) • Excel spreadsheets (10%) • Executable file (5%) • Other (15%)
Parameters- Communication • Probability that a communication is checked immediately (70%) • Average delay to respond to a communication (1 hour) • Average number of recipients of an email message (3)
Parameters- Anti-Virus • Probability that a computer has effective anti-virus software (80%, 95%) [AV] • Probability per day of a computer’s exposure to a virus from an outside source (0.1%, 0.5%, 2%) [Exposure]
Parameters- Behavior • Probability that a virus recipient notifies sender and administrator (10%, 25%, 50%, 75%, 90%) [Notify] • Probability that a user who is notified that they have a virus will be able to successfully remove it (85%) • Probability per day that a user without effective anti-virus software will recognize a virus (5%)
The Simulation- Initialization • Initialize random number generators • Read input parameters from file • Randomly configure and assign virus types • Construct network as an array of computer objects • Determine which machines have effective anti-viral software • Determine which computers are initially infected
Simulation- One Day • Simulation is managed by SimTime, with 8 units of time to one day. • At the start of the day • Record the network status • Introduce n new external infections by sampling a binomial distribution • Re-Introduce m infections from previously cleaned machines by sampling a binomial distribution
Simulation- One Communication • Sample from an exponential distribution to determine the time of the communication. • Sample from uniform distribution to determine the sending computer. • Determine the type of communication • For email communications, sample from an exponential distribution to determine the number of recipients.
Simulation- Response • For each computer that receives a message, check to see if the computer user will respond immediately to the message. • If not, sample from an exponential distribution to determine the wait time. • If the wait time extends beyond the current day, response will occur at the start of the next day.
Simulation- Virus? • Is there a virus? Can it be passed in this communication? • Yes: • This communication event is done. • No: • Does the anti-virus software stop it? • Yes: check to see if the user informs the sender and the network administrator. • No: then infect this machine.
Simulation- Recovery • If a user is informed that they sent a virus, then they attempt to clean their machine. • If the network administrator receives sufficiently many notifications of virus activity, then the entire network attempts to clean their machine. • At the end of each day, check to see if a user notices a virus on their machine. If so, then the attempt to clean their machine.
Effective Contacts • The number of effective contacts per communication event is
Analytic Model- Variables • y is the fraction of infected machines • CV = (Comm/200)Vis the daily contact rate • is the fraction of machines with effective anti-virus software • V = Recognize + CV (Notify)(Cleanup) • GVis the fraction of new infections from a particular virus V.
Analytic Model • Our simplified model, for each virus V is • This equation is autonomous, and has a stable equilibrium point Infection rate due to contact with infected machines on the network Rate at which machines are cleaned; either by recognition or by cleanup after a notification Rate at which machines are infected because of exposure to an outside virus