Modeling Sine & Cosine
80 likes | 356 Views
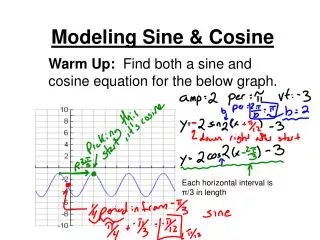
Modeling Sine & Cosine. Warm Up: Find both a sine and cosine equation for the below graph. Each horizontal interval is π /3 in length. A company that produces snowboards, which are seasonal products, forecasts monthly sales for 1 year to be

Modeling Sine & Cosine
E N D
Presentation Transcript
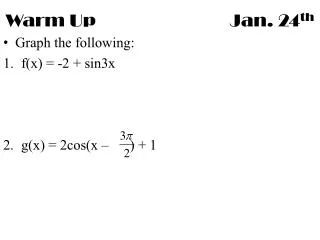
Modeling Sine & Cosine Warm Up: Find both a sine and cosine equation for the below graph. Each horizontal interval is π/3 in length
A company that produces snowboards, which are seasonal products, forecasts monthly sales for 1 year to be Where S is the sales in thousands of units and t is the time in months, with t = 1 corresponding to January. • Use a graphing utility to graph the sales function over the one-year period. • Use the graph in part (a) to determine the months of maximum and minimum.
The percent, y, of the moon’s face that is illuminated on day, x, of the year 2006, where x = 1 represents January 1, is shown in the table. • Create a scatter plot of the data. • Find a trigonometric model for the data. • Add the graph of your model to the scatter plot. How well does the model fit the data? • What is the period of the model? • Estimate the percent illumination of the moon on June 22, 2007
The percent, y, of the moon’s face that is illuminated on day, x, of the year 2006, where x = 1 represents January 1, is shown in the table. • Create a scatter plot of the data.
The percent, y, of the moon’s face that is illuminated on day, x, of the year 2006, where x = 1 represents January 1, is shown in the table. b) Find a trigonometric model for the data.
The percent, y, of the moon’s face that is illuminated on day, x, of the year 2006, where x = 1 represents January 1, is shown in the table. c) Add the graph of your model to the scatter plot. How well does the model fit the data? This one was drawn using…
The percent, y, of the moon’s face that is illuminated on day, x, of the year 2006, where x = 1 represents January 1, is shown in the table. • What is the period of the model? e) Estimate the percent illumination of the moon on June 22, 2007
Given a set of data (x,y) how do you find/do the following? Sine? Or Cosine? Amplitude: Does this change depending upon sine or cosine? Period: Does this change depending upon sine or cosine? PS: Does this change depending upon sine or cosine? VT: Does this change depending upon sine or cosine?