Vertical Data 3
Vertical Data 3. YOUR DATA MINING. YOUR DATA. Data Integration Language DIL. Ptree ( Predicates ) Query Language PQL. DII (Data Integration Interface). DMI (Data Mining Interface). Data Repository lossless, compressed, distributed, vertically-structured database.


Vertical Data 3
E N D
Presentation Transcript
YOUR DATA MINING YOUR DATA Data Integration Language DIL Ptree (Predicates) Query Language PQL DII (Data Integration Interface) DMI (Data Mining Interface) Data Repository lossless, compressed, distributed, vertically-structured database The DataMIME™ System(DataMIMEtm = Data Mining, NO NOISE) Internet
Decimal Binary Unsorted relation Generalized Raster and Peano Sorting: generalizes to any table with numeric attributes (not just images). Raster Sorting: Attributes 1st Bit position 2nd Peano Sorting: Bit position 1st Attributes 2nd
Unsorted Generalized Raster Generalized Peano crop adult spam function mushroom Generalize Peano Sorting KNN speed improvement (using 5 UCI Machine Learning Repository data sets) 120 100 80 Time in Seconds 60 40 20 0
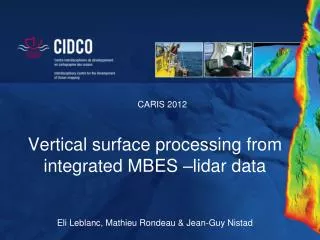
Astronomy Application:(National Virtual Observatory data) What Ptree dimension and ordering should be used for astronomical data?, where all bodies are assumed to lie on the surface of a celestial sphere (shares its origin and equatorial plane with earth but has no specified radius) Hierarchical Triangle Mesh Tree (HTM-tree, seems to be an accepted standard) Peano Triangle Mesh Tree (PTM-tree) is a [better?] alternative - at least for data mining? (Note: RA=Recession Angle (=longitudinal angle); dec=declination (=latitudinal angle) PTM is similar to HTM used in the Sloan Digital Sky Survey project (which is a project to create a National Virtual Observatory of all [?] telescope data integrated into one repository). In both: • The Celestial Sphere is divided into triangles with great circle segment sides. • But PTM differs from HTM in the way in which these triangles are ordered at each level.
1,2 1,2 1,3,3 1,1,2 1,0 1,3,0 1,1,1 1,0 1,1,0 1,1 1,3 1,3,2 1,1 1.1.3 1,3,1 1,3 The difference between HTM and PTM-trees is in the ordering. 1 1 Ordering of PTM-tree Ordering of HTM Why use a different ordering?
dec RA PTM Triangulation of the Celestial Sphere The following ordering produces a sphere-surface filling curve with good continuity characteristics, The picture at right shows the earth (blue ball at the center) and the celestial sphere out around it. Traverse southern hemisphere in the revere direction (just the identical pattern pushed down instead of pulled up, arriving at the Southern neighbor of the start point. Next, traverse the southern hemisphere in the revere direction (just the identical pattern pushed down instead of pulled up, arriving at the Southern neighbor of the start point. left Equilateral triangle (90o sector) bounded by longitudinal and equatorial line segments right right left turn Traverse the next level of triangulation, alternating again with left-turn, right-turn, left-turn, right-turn..
PTM-triangulation - Next Level LRLR RLRL LRLR RLRL LRLR RLRL LRLR RLRL LRLR RLRL LRLR RLRL LRLR RLRL LRLR RLRL
90o 0o -90o 0o 360o Z Z Z Z Z Z Z Z Z Z Z Z Z Z Z Z Z Z Z Z Z Z Z Z Z Z Z Z Z Z Z Z Z Z Z Z Z Z Z Z Z Z Z Z Z Z Z Z Z Z Z Z Z Z Z Z Z Z Z Z Z Z Z Z Z Z Z Z Z Z Z Z Z Z Z Z Z Z Z Z Z Z Z Z Z Z Z Z Z Z Z Z Z Z Z Z Z Z Z Z Z Z Z Z Z Z Z Z Z Z Z Z Z Z Z Z Z Z Z Z Z Z Z Z Z Z Z Z Z Z Z Z Z Z Z Z Z Z Z Z Z Z Z Z Z Z Z Z Z Z Z Z Z Z Z Z Z Z Z Z Z Z Z Z Z Z Z Z Z Z Z Z Z Z Z Z Z Z Z Z Z Z Z Z Z Z Z Z Z Z Z Z Z Z Z Z Z Z Z Z Z Z Z Z Z Z Z Z Z Z Z Z Z Z Z Z Z Z Z Z Z Z Z Z Z Z Z Z Z Z Z Z Z Z Z Z Z Z Z Z Z Z Z Z Z Z Z Z Z Z Z Z Z Z Z Z Z Z Z Z Z Z Z Z Z Z Z Z Z Z Z Z Z Z Z Z Z Z Z Z Z Z Z Z Z Z Z Z Z Z Z Z Z Z Z Z Z Z Z Z Z Z Z Z Z Z Z Z Z Z Z Z Z Z Z Z Z Z Z Z Z Z Z Z Z Z Z Z Z Z Z Z Z Z Z Z Z Z Z Z Z Z Z Z Z Z Z Z Z Z Z Z Z Z Z Z Z Z Z Z Z Z Z Z Z Z Z Z Z Z Z Z Z Z Z Z Z Z Z Z Z Z Z Z Z Z Z Z Z Z Z Z Z Z Z Z Z Z Z Z Z Z Z Z Z Z Z Z Z Z Z Z Z Z Z Z Z Z Z Z Z Z Z Z Z Z Z Z Z Z Z Z Z Z Z Z Z Z Z Z Z Z Z Z Z Z Z Z Z Z Z Z Z Z Z Z Z Z Z Z Z Z Z Z Z Z Z Z Z Z Z Z Z Z Z Z Z Z Z Z Z Z Z Z Z Z Z Z Z Z Z Z Z Z Z Z Z Z Z Z Z Z Z Z Z Z Z Z Z Z Z Z South Plane Plane Peano Celestial Coordinates Unlike PTM-trees which initially partition the sphere into the 8 faces of an octahedron, in the PCCtree scheme: The Sphere is tranformed to a cylinder, then into a rectangle, then standard Peano ordering is used on the Celestial Coordinates. • Celestial Coordinates Recession Angle (RA) runs from 0 to 360o dand Declination Angle (dec) runs from -90o to 90o. Sphere Cylinder
SubCell-Location Myta Ribo Nucl Ribo 17, 78 12, 60 Mi, 40 1, 48 10, 75 0 0 7, 40 0 14, 65 0 0 16, 76 0 9, 45 1, 43 Function apop meio mito apop StopCodonDensity .1 .1 .1 .9 PolyA-Tail 1 1 0 0 Organism Species Vert Genome Size (million bp) Gene Dimension Table g0 g1 g2 g3 o0 human Homo sapiens 1 3000 Organism Dimension Table o1 fly Drosophila melanogaster 0 185 o2 1 1 1 1 1 0 0 1 0 1 0 0 1 0 1 1 o3 0 1 0 1 1 0 0 1 0 1 0 1 1 0 0 0 yeast Saccharomyces cerevisiae 0 12.1 e0 1 0 1 1 0 1 1 1 1 1 0 1 1 0 1 0 e0 mouse Mus musculus 1 3000 e1 e1 e2 e2 e3 LAB PI UNV STR CTY STZ ED AD S H M N e3 Experiment Dimension Table (MIAME) 3 2 a c h 1 2 2 b s h 0 2 4 a c a 1 2 4 a s a 1 PUBLIC (Ptree Unfied BioLogical InformtiCs Data Cube and Dimension Tables) Gene-OrganismDimension Table (chromosome,length) Gene-Experiment-Organism Cube (1 iff that gene from that organism expresses at a threshold level in that experiment.) many-to-many-to-many relationship
Association of Computing Machinery KDD-Cup-02http://www.biostat.wisc.edu/~craven/kddcup/winners.html BIOINFORMATICS Task: Yeast Gene Regulation Prediction • There are now experimental methods that allow biologists to measure some aspect of cellular "activity" for thousands of genes or proteins at a time. A key problem that often arises in such experiments is in interpreting or annotating these thousands of measurements. This KDD Cup task focused on using data mining methods to capture the regularities of genes that are characterized by similar activity in a given high-throughput experiment. To facilitate objective evaluation, this task did not involve experiment interpretation or annotation directly, but instead it involved devising models that, when trained to classify the measurements of some instances (i.e. genes), can accurately predict the response of held aside test instances. • The training and test data came from recent experiments with a set ofS. cerevisiae (yeast) strains in which each strain is characterized by a single gene being knocked out. Each instance in the data set represents a single gene, and the target value for an instance is a discretized measurement of how active some (hidden) system in the cell is when this gene is knocked out. The goal of the task is to learn a model that can accurately predict these discretized values. Such a model would be helpful in understanding how various genes are related to the hidden system. • The best overall score (Kowalczyk) was 1.3217 (summed AROC for the two partitions). The best score for the "narrow" partition was 0.6837 (Denecke et al), and the best score for the "broad" partition was 0.6781 (Amal Perera, Bill Jockheck, Willy Valdivia Granda, Anne Denton, Pratap Kotala and William Perrizo, North Dakota State UniversityKDD Cup Pagehttp://www.acm.org/sigkdd/explorations/
Association of Computing Machinery KDD-Cup-02http://www.biostat.wisc.edu/~craven/kddcup/winners.html My Team
Association of Computing Machinery KDD-Cup-06http://www.cs.unm.edu/kdd_cup_2006http://www.cs.ndsu.nodak.edu/~datasurg/kddcup06/kdd6News.html MEDICAL INFORMATICS Task: Computer Aided Detection of Pulmonary Embolism Description of CAD systems: Over the last decade, Computer-Aided Detection (CAD) systems have moved from the sole realm of academic publications, to robust commercial systems that are used by physicians in their clinical practice to help detect early cancer from medical images. For example, CAD systems have been employed to automatically detect (potentially cancerous) breast masses and calcifications in X-ray images, detect lung nodules in lung CT (computed tomography) images, and detect polyps in colon CT images to name a few CAD applications. CAD applications lead to very interesting data mining problems. Typical CAD training data sets are large and extremely unbalanced between positive and negative classes. Often, fewer than 1% of the examples are true positives. When searching for descriptive features that can characterize the target medical structures, researchers often deploy a large set of experimental features, which consequently introduces irrelevant and redundant features. Labeling is often noisy as labels are created by expert physicians, in many cases without corresponding ground truth from biopsies or other independent confirmations. In order to achieve clinical acceptance, CAD systems have to meet extremely high performance thresholds to provide value to physicians in their day-to-day practice. Finally, in order to be sold commercially (at least in the United States), most CAD systems have to undergo a clinical trial (in almost exactly the same way as a new drug would). Typically, the CAD system must demonstrate a statistically significant improvement in clinical performance, when used, for example, by community physicians (without any special knowledge of machine learning) on as yet unseen cases – i.e., the sensitivity of physicians with CAD must be (significantly) above their performance without CAD, and without a corresponding marked increase in false positives (which may lead to unnecessary biopsies or expensive tests). In summary, very challenging machine learning and data mining tasks have arisen from CAD systems
Association of Computing Machinery KDD-Cup-06 http://www.cs.unm.edu/kdd_cup_2006http://www.cs.ndsu.nodak.edu/~datasurg/kddcup06/kdd6News.html Challenge of Pulmonary Emboli Detection: Pulmonary embolism (PE) is a condition that occurs when an artery in the lung becomes blocked. In most cases, the blockage is caused by one or more blood clots that travel to the lungs from another part of your body. While PE is not always fatal, it is nevertheless the third most common cause of death in the US, with at least 650,000 cases occurring annually.1 The clinical challenge, particularly in an Emergency Room scenario, is to correctly diagnose patients that have a PE, and then send them on to therapy. This, however, is not easy, as the primary symptom of PE is dysapnea (shortness of breath), which has a variety of causes, some of which are relatively benign, making it hard to separate out the critically ill patients suffering from PE. The two crucial clinical challenges for a physician, therefore, are to diagnose whether a patient is suffering from PE and to identify the location of the PE. Computed Tomography Angiography (CTA) has emerged as an accurate diagnostic tool for PE. However, each CTA study consists of hundreds of images, each representing one slice of the lung. Manual reading of these slices is laborious, time consuming and complicated by various PE look-alikes (false positives) including respiratory motion artifacts, flowrelated artifacts, streak artifacts, partial volume artifacts, stair step artifacts, lymph nodes, and vascular bifurcation, among many others. Additionally, when PE is diagnosed, medications are given to prevent further clots, but these medications can sometimes lead to subsequent hemorrhage and bleeding since the patient must stay on them for a number of weeks after the diagnosis. Thus, the physician must review each CAD output carefully for correctness in order to prevent overdiagnosis. Because of this, the CAD system must provide only a small number of false positives per patient scan. CAD system Goal: To automatically identify PE’s. In an almost universal paradigm for CAD algorithms, this problem is addressed by a 3 stage system: 1. Identification of candidate regions of interest (ROI) from a medical image, 2. Computation of descriptive features for each candidate, and 3. Classification of each candidate (in this case, whether it is a PE or not) based on its features. NPV Task: One of the most useful applications for CAD would be a system with very high (100%?) Negative Predictive Value. In other words, if the CAD system had zero positive candidates for a given patient, we would like to be very confident that the patient was indeed free from PE’s. In a very real sense, this would be the “Holy Grail” of a PE CAD system. The best NPV score was by Amal Perera, William Perrizo, North Dakota State University (twice as high as the next best score!) http://www.acm.org/sigs/sigkdd/explorations/issue.php?volume=8&issue=2&year=2006&month=12
Association of Computing Machinery KDD-Cup-06 Professor William Perrizo and his PhD student Amal Shehan Perera of the department of computer science at North Dakota State University (NDSU) won the KDD-Cup 2006 Knowledge Discovery and Data Mining competition which was held in conjunction with the ACM SIGKDD International Conference on Knowledge Discovery and Data Mining. The ACM KDD-Cup is the most rigorous annual competition in the field of data mining and machine learning. The competition is open to all academic institutes, industries as well as individuals from around the world. Since its inception in 1997, the KDD-Cup competition has presented practical and challenging data mining problems. Considerable number of researchers and practitioners participate in this annual contest. KDD-Cup datasets have become benchmarks for data mining research over the years. KDD-Cup 2006 was conducted between May and August 2006 by the Association for Computing Machinery(ACM) Special Interest Group on Knowledge Discovery and Data Mining (SIGKDD). This year’s contest was for a Computer-Aided Detection (CAD) system that could identify pulmonary embolisms, or blood clots, in the lung through examinations of the features from Computed Tomography (CT) images. A typical CT study consists of hundreds of images, each representing one slice of the lung. Manual reading of these slices is laborious, time consuming and complicated. It is also very important to be accurate in the prediction. NDSU team won the Negative Predictive Value (NPV) task of the competition, which was characterized by the organizers as the "Holy Grail" of Computer Aided Detection (CAD) of pulmonary embolisms. Siemens Medical Solutions provided dataset for the contest. Over 200 teams from around the world registered for the competition and 65 entries were submitted. This year's tasks were particularly challenging due to multiple instance learning, nonlinear cost functions, skewed class distributions, noisy class labels, and sparse data space. The NDSU team used a combined nearest neighbor and boundary classification with genetic algorithm parameter optimization. Dr. William Perrizo is a senior Professor in Computer Science at the North Dakota State University. He leads the Data Systems Users and Research Group (DataSURG) involved in innovative research on scalable data mining research using vertical data structures in the Computer Science Department at NDSU. DataSURG has been supported by NSF, NASA, DARPA, and GSA. Amal Shehan Perera is a lecturer at the Department of Computer Science and Engineering at the University of Moratuwa, Sri Lanka on study leave where he completed his PhD at NDSU.


![4.2 [3] How to Engage Vertical Participation](https://cdn1.slideserve.com/2462029/4-2-3-how-to-engage-vertical-participation-dt.jpg)