Public spending
Public spending. Gemma Tetlow. Outlook for the next spending review. Big picture: spending growth 2011–12 to 2013–14 Total spending: frozen in real terms Current spending: +0.8% p.a. Investment spending: –19.2% p.a. Spending Review 2010 period: 2011–12 to 2013–14

Public spending
E N D
Presentation Transcript
Public spending Gemma Tetlow
Outlook for the next spending review • Big picture: spending growth 2011–12 to 2013–14 • Total spending: frozen in real terms • Current spending: +0.8% p.a. • Investment spending: –19.2% p.a. • Spending Review 2010 period: 2011–12 to 2013–14 • Squeeze on departmental spending tighter, mostly reflects additional military spending in the “base” year • Spending in several priority areas to be ‘protected’ for first two years
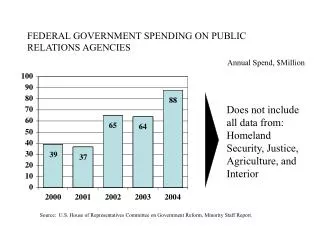
Departmental spending: When will the pain be felt? Total cut: –£35.7bn
Departmental spending: When will the pain be felt? Total cut: –£35.7bn
What cuts to departmental spending have they identified? • Total cut required by 2013–14: £35.7bn • Cuts already claimed, by 2012–13 • Efficiency savings: £11bn • Tight control of public sector pay: £3.4bn • Reforms to public sector pensions: £1bn • Cuts to lower priority budgets: £5bn • Additional cut claimed for 2013–14 • Efficiency savings: £1bn • Remaining gap? • About £15bn
Past record on efficiency savings • Spending Review 2004 period • £26.5bn efficiency savings claimed • NAO audit half-way through suggested: 25% did not adequately demonstrate true efficiencies, another 50% questionable • Comprehensive Spending Review 2007 period • £35bn efficiency savings promised • PBR 2009 confirms £8.5bn delivered by mid-2009/10 • Another £26.5bn to come before end 2010–11?
But some areas are to be ‘protected’... • Health • Real freeze in near cash NHS spending in 2011–12 and 2012–13 • Schools • 0.7% real increase in “front-line” schools spending in 2011–12 and 2012–13 • Costs an additional £0.7bn in 2012–13 • Sure Start • Real freeze in spending in 2011–12 and 2012–13 • Overseas Development Assistance • Meet 2013 target of spending 0.7% of Gross National Income • Requires average real growth of 11.3% • Additional £1.9bn by 2012–13, plus further £1.1bn in 2013–14
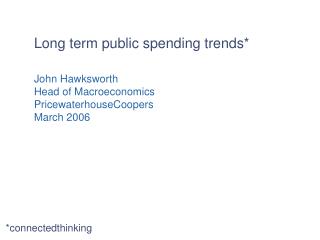
Implications for other departments? Average annual real growth: 2011–12 and 2012–13 –£22.9bn
Implications for other departments? Average annual real growth: 2011–12 and 2012–13
Implications for other departments? Average annual real growth: 2011–12 and 2012–13
Implications for other departments? Average annual real growth: 2011–12 and 2012–13
Implications for other departments? Average annual real growth: 2011–12 and 2012–13 –£25.5bn, cumulative cut 12.3%
Summary of implications for other DELs • By 2012–13: • Cuts to real DEL of £22.9bn • Pledges to increase some real spending mean additional £2.6bn must be found elsewhere • Total cuts required: £25.5bn • Any of the currently identified savings (totalling £20.4bn) that fall within protected budgets cannot contribute to the spending cut • In 2013–14: • If meet ODA target, additional cut to other DEL required: £14.0bn • Equates to further 4.0% real cut for non-ODA DEL • Additional efficiency savings identified: £1bn • Significant unprotected areas: • Defence, Higher Education, Transport and Housing
Public service spending increase in Labour’s second and third terms reversed
Where do the Conservatives plans stand? • Pledges on DEL: • Meet ODA target • Freeze NHS spending • If match Labour’s plans for total spending: • Cut required elsewhere by 2013–14: £38.8bn • Osborne’s conference speech claimed £7bn of cuts • Caveats: • Any of these found within NHS budget do not save money overall • Not all are necessarily additional to the Government’s proposals • Presumably will adopt any genuine Government efficiency savings • Remaining gap? • £10.4bn–£21.4bn
Summary (1) • Total public spending broadly flat in real terms over 2011–12 to 2013–14 • current spending to grow, deep cuts to investment spending • Under current policies some spending likely to grow • debt interest (10.7% p.a.), social security spending (1.5% p.a.) and other Annually Managed Expenditure (3.1% p.a.) • Implies cuts to central government spending on public services • Departmental Expenditure Limits could fall by 3.2% a year • £36bn lower in 2013–14 compared to 2010–11 • £15bn larger than total of efficiency savings and cuts claimed so far
Summary (2) • Over first two years 2011–12 and 2012–13 • Departmental Expenditure Limits to be cut by 3.0% a year, or £22.9bn in total • ‘Front-line’ health, schools, Sure Start and Overseas Aid pledge all ‘protected’ • other areas facing average cuts of 6.4% a year, or £25.5bn in total • severe cuts to fall elsewhere, potentially in areas such as defence, higher education, transport and housing • All of the increase in central government spending on public services over Labour’s second and third term reversed by 2013–14 • potentially first term increases also to be reversed by 2017–18
Post Pre-Budget Report briefing Institute for Fiscal Studies, 10th December 2009 www.ifs.org.uk