Download
1 / 2
20 likes | 124 Views
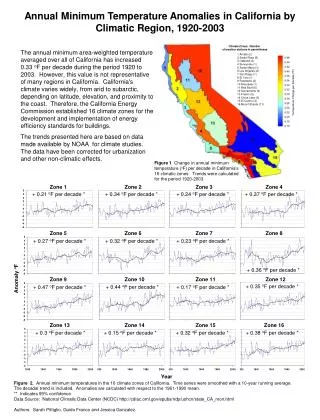
Annual Minimum Temperature Anomalies in California by Climatic Region, 1920-2003. Climate Zones. Number of weather stations in parentheses.

E N D
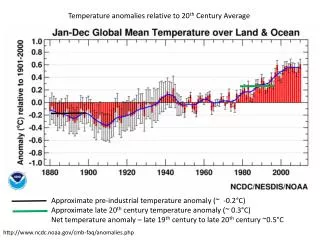
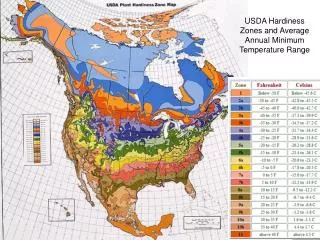
Annual Minimum Temperature Anomalies in California by Climatic Region, 1920-2003 Climate Zones. Number of weather stations in parentheses The annual minimum area-weighted temperature averaged over all of California has increased 0.33 oF per decade during the period 1920 to 2003. However, this value is not representative of many regions in California. California's climate varies widely, from arid to subarctic, depending on latitude, elevation, and proximity to the coast. Therefore, the California Energy Commission established 16 climate zones for the development and implementation of energy efficiency standards for buildings. The trends presented here are based on data made available by NOAA for climate studies. The data have been corrected for urbanization and other non-climatic effects. 1 Arcata (2) 2 Santa Rosa (6) 3 Oakland (2) 4 Sunnyvale (1) 5 Santa Maria (1) 6 Los Angeles (2)7 San Diego (1)8 El Toro (1) 9 Pasadena (2)10 Riverside (1)11 Red Bluff (6)12 Sacramento (6)13 Fresno (5) 14 China Lake (3)15 El Centro (4)16 Mount Shasta (11) Temperature Change per Decade (oF) Figure 1 Change in annual minimum temperature (oF) per decade in California’s 16 climatic zones. Trends were calculated for the period 1920-2003. Figure 2. Annual minimum temperatures in the 16 climate zones of California. Time series were smoothed with a 10-year running average. The decadal trend is included. Anomalies are calculated with respect to the 1961-1990 mean. ** Indicates 99% confidence Data Source: National Climatic Data Center (NCDC) http://cdiac.ornl.gov/epubs/ndp/ushcn/state_CA_mon.html Authors: Sarah Pittiglio, Guido Franco and Jessica Gonzalez.
Annual Maximum Temperature Anomalies in California by Climatic Region, 1920-2003 Climate Zone. Number of weather stations in parentheses 1 Arcata (2) 2 Santa Rosa (6) 3 Oakland (2) 4 Sunnyvale (1) 5 Santa Maria (1) 6 Los Angeles (2)7 San Diego (1)8 El Toro (1) 9 Pasadena (2)10 Riverside (1)11 Red Bluff (6)12 Sacramento (6)13 Fresno (5) 14 China Lake (3)15 El Centro (4)16 Mount Shasta (11) The annual maximum area-weighted temperature averaged over all of California has increased 0.1 oF per decade during the period 1920 to 2003. Maximum hourly temperatures occur during the daytime and minimum temperatures at night. Current research suggests that the effect of rising temperatures due to global warming may be masked by the cooling effects of irrigation and reflective particles in the atmosphere. The masking effect has a stronger influence on daytime temperatures and areas with extensive agriculture. Temperature Change per Decade (oF) Figure 3 Change in annual maximum temperature (oF) per decade in California’s 16 climatic zones. Trends were calculated for the period 1920-2003. Figure 4. Annual maximum temperatures in the 16 climate zones of California. Time series were smoothed with a 10-year running average. The decadal trend is included. Anomalies are calculated with respect to the 1961-1990 mean. ** Indicates 99% confidence ** Indicates 95% confidence ^ Indicates no statistical significance Data Source: National Climatic Data Center (NCDC) http://cdiac.ornl.gov/epubs/ndp/ushcn/state_CA_mon.html Authors: Sarah Pittiglio, Guido Franco and Jessica Gonzalez. CEC-500-2008-085