Download
1 / 33
330 likes | 350 Views
This workshop presentation discusses the concepts, measurement methods, and challenges in measuring and monitoring poverty for international and national purposes, with a focus on the Millennium Development Goals (MDGs). It covers topics such as defining and measuring poverty, choice of welfare measure, setting the poverty line, and international poverty estimates. The presentation also provides further reading and sources on the International Poverty Line (IPL) and global poverty measures.

E N D
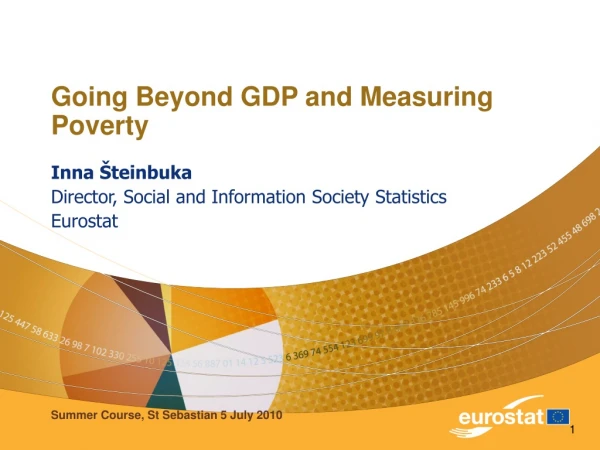
measuring and monitoring poverty for the MDGs estimating extreme poverty for international and national purposes Tim Conway, World Bank Cambodia Country Office UNSD / ESCAP Workshop on MDG Monitoring Bangkok, 14-16 January 2009
outline • defining and measuring poverty: a very brief recap • measurement, description, explanation, and targeting • national poverty estimates • Choice of welfare measure • Process of setting the poverty line • the international poverty line (IPL) • IDTs, MDGs and “dollar-a-day” • the International Comparison Project 2005 and the new 2008 IPL • summary of differences and similarities between old and new estimates • current issues • remaining issues with international poverty estimates • which poverty line to use for what purposes? • basic principles • further reading • sources on the IPL, IPC and global poverty measures
1: concept to measurement why measure poverty? • poverty reduction a critical goal of almost all modern states, particularly in the developing world • and, since 2000, an international commitment (MDG 1.1) • reliable, consistent poverty measures support policy effectiveness and accountability by enabling: • analysis of the causes of poverty and formulation of appropriate policies to tackle these causes • targeting of limited resources to where poverty is highest • monitoring poverty trends to assess if policies are working • evaluating the impact of policies, programmes or shocks
1: concept to measurement defining and measuring poverty is as much an art as a science “In sum, there is no ideal measure of well-being. The implication is simple: all measures of poverty are imperfect. This is not an argument for avoiding poverty measurement, but rather for approaching all measures of poverty with a degree of caution, and for asking in some detail how the measures are constructed.” Introduction to poverty analysis (World Bank 2005 p. 40, emphasis added)
1: concept to measurement measuring poverty: 3 steps • choosing a welfare measure • i.e. income or consumption • defining a poverty line • setting a minimum level of the chosen welfare measure, below which an individual is said to be poor • collecting welfare data through a survey and comparing it to the poverty line to obtain estimates of: • what percentage of the population falls below the poverty line (the poverty headcount or poverty incidence) • and by how much (the poverty gap and the squared poverty gap)
2: national poverty estimates a short history of national poverty estimates the first household welfare surveys • household budget surveys in England in late 1700s • and in Germany in early 1800s • Charles Booth credited with the first poverty survey (London 1889) • colonial governments conducted surveys; but sampling & analysis often poor development of modern sampling theory in 1920s and 1930s national surveys and poverty monitoring since World War II • Indian National Sample Survey (NSS) established in 1950s • Foster-Greer-Thorbecke (FGT) poverty indices (1984) • spread of PCs in late 1970s/early 1980s allowed rapid expansion of survey programmes (e.g. LSMS, DHSetc.)
2: national poverty estimates means and ends:functional relationships between different welfare / poverty measures Housing quality and consumer durables (Stock of past investments) Happiness, quality of life market savings Human development outcomes (health, education etc.) current consumption value of housing and consumer durables Privately-purchased goods and services Total household current consumption (starting with food) income productive assets Publicly-provided goods and services Consumption of household-produced goods and services Household economic activity / production state
2: national poverty estimates choice of welfare measure variesexamples from Asia countries welfare measure per capita consumption Afghanistan, Bangladesh, Bhutan, Cambodia, Lao PDR, Thailand per capita income China, Philippines household income Malaysia
2: national poverty estimates setting a national poverty line • start by setting the food poverty line • estimating food consumption required to obtain minimum healthy nutrition (typically 2,100 calories per person per day) • typically using a survey to look at the food consumption bundle of the quintile around the poverty line for composition • Then estimate a minimum consumption level required to meet basic non-food needs • clothing, housing, health care, education… • various alternative approaches to this • Add the food and non-food allowances to obtain a total poverty line: or, simply, the poverty line • NB poverty lines often calculated separately for regions of the country with very different consumption bundles / price levels
2: national poverty estimates collecting data & generating poverty measures:summary of some key survey design issues and tradeoffs • policy – and political - timetable • preparation of national development / poverty reduction strategies • election cycle • coverage • spatial (changing coverage between rounds makes it hard to identify trend) • thematic (very easy to overload a survey instrument) • frequency required • scale of disaggregation required • consistency and comparability • cost and available resources • complexity, national capacity, and ownership • include a panel component?
3: international poverty estimates origins of the international poverty line, late 1990s • International community sought to define a list of global development priorities • first the OECD-DAC International Development Targets (IDTs) • and then, at the Millennium General Assembly in 2000, the MDGs • consolidated from targets agreed at UN conferences during the 1990s, most targets were for human development • an indicator for absolute poverty was set on the basis of what, in local currency unit equivalents, a dollar could buy in the US in 1990, i.e. US$1 per capita per day, 1990 purchasing power parity (PPP) • this had been used in World Development Report (WDR) 1990 on poverty • chosen because among 33 countries for which WDR 1990 had survey data, poverty lines for the poorest ranged from $0.75-$1 pc per day, 1985 PPP • this became the international poverty line (IPL) • and the basis for MDG 1: “to cut, by 2015, the percentage of the world’s population living in absolute poverty to half its 1990 level”
3: international poverty estimates over time, estimates of global poverty have changed This is due to: • changing definition of the IPL (in US$ per capita per day) • 1990: $1 1985 PPP • 2000: $1.08 1993 PPP • 2008: $1.25 2005 PPP • reflecting • updated (and better) data in relative prices • new household surveys (which have increased coverage of the population of the developing world) • plus some methodological refinements However, the basic principles and steps remain the same
3: international poverty estimates revising the international poverty line 1998 • UN Evaluation of the ICP (the Ryten Report) identified concerns in ICP 1993-6 2000 • 2000/01 World Development Report on Poverty (WDR 2000/01): compared to WDR 1990, • drew on 1993 ICP price data • and a larger sample of household surveys • modified the IPL slightly to $1.08 per capita per day, 1993 PPP • but the “dollar-a-day” label stuck 2002-7 • Deaton (2002)criticised World Bank (2002) for mixing methodologically inconsistent estimates from different sources to come up with a misleading picture of trend • Chen & Ravallion (2004) attempted to address these concerns • And updated this analysis with new household surveys, bringing estimates up to 2004 (Chen & Ravallion 2007) 2008 • new and better PPPs for more countries from the 2005 ICP • found that cost of living in developing countries higher than had previously been thought • new IPL set at $1.25 pc per day 2005 PPP • average of national poverty lines in 15 poorest countries • As a result: • estimates of the real size of developing economies revised downwards • and poverty estimates revised upwards
3: international poverty estimates calculating international poverty estimates- basic principles, illustrated with new 2008 estimates • Define a representative international poverty line in a reference currency (US $) • Rank countries by real mean per capita consumption • Convert mean national per capita consumption values into $ using purchasing power parity (PPP) exchange rates (in 2008, using PPPs from the 2005 round of the ICP) • Take the poorest countries in this list (in 2008, the poorest 15 countries) • convert their national poverty lines into $ using PPPs • And average these: the mean of these standardised poverty lines from the poorest countries ($1.27 pc per day) is taken as the definition of absolute poverty • Convert the IPL (in 2008, $1.25 pc per day) into all local currency units (LCU) • Again, using PPPs from the most recent ICP data year (in 2008, using 2005 PPPs) • Deflate this LCU poverty line value to the year(s) for which have survey data • using the official national CPI data for each country • NB weights in this index may or may not match consumer budget shares at the poverty line • Use this poverty line to generate poverty estimates for that year • Where necessary, use interpolation to generate poverty estimates for reference years in the IPL reporting series (i.e. every three years from 1981 to 2005) • Use pc growth rates from national accounts data • projected poverty estimates back from the survey immediately after the reference year • and project forward from the survey immediately before it • Obtain the mean of these two projected values: take this as the value for that year
3: international poverty estimates three key improvements in the 2008 revisions • better data on relative prices from ICP 2005 • updated poverty line to reflect new PPPs • better data on household consumption
3: international poverty estimates better data on relative prices The 2005 round of the ICP improved considerably on 1993: • covered more countries • 1968 (first) ICP: 10 • 1993 ICP: 117 • 2005 ICP: 146 – including China for the first time • more detailed descriptions of goods and services to ensure stricter comparison, and larger number of data points for each item in each country • new methods to measure and price difficult cases • government compensation; housing; and public sector productivity • more ring comparisons (18) to link regional PPP estimates to global prices Improvements reflected: • Adoption of recommendations from the Rysten Report • Better funding
3: international poverty estimates updated international poverty line:why $1.25? • Ravallion, Chen and Sangraula (2007) created a dataset of 74 countries for which it is possible to plot both • national poverty lines; and • the log of mean per capita consumption (both converted into 2005 US$ using the new PPPs) • The 15 poorest countries – that is, the 15 with lowest per capita consumption – had a mean poverty line (in 2005 PPP terms) of $1.27 per capita per day • This line is taken as a good definition of absolute poverty
3: international poverty estimates better data on household consumption • Expanding dataset of countries and surveys between poverty estimation exercises • And expanding number of total surveys, so more survey years (data points) for each country • total 675 surveys • As a result, more recent estimates are able to draw on increasing recent coverage of the population of the developing world
3: international poverty estimates % of population represented by a survey conducted 2 years before or after the reference date Source: Chen and Ravallion 2008p. 30
3: international poverty estimates How do the new changes affect findings?new estimates suggest poverty higher than previously thought,but global and regional poverty trends essentially the same Using the 2008 revisions: • estimated global poverty level in 2005 rises from 1bn to 1.4bn • but the trend that results is largely the same as under the old estimates • applying the new PPPs and poverty line to earlier years raises poverty estimates for those years, too
3: international poverty estimates trend using the new line is similar to that using the old:from 1981 to 2005 • global poverty incidence has halved (from 52% to 26%) • driven largely by rapid falls in east Asia • and to a lesser degree south Asia • while poverty incidence is unchanged in sub-Saharan Africa
4: current issues remaining issues with the IPL • urban bias in the ICP price data • especially in China; also 11 other countries; partially in India • use rural-urban differentials in national poverty lines to calibrate these cases • relevance of ICP consumption bundles (items and weights) to the poor: a case for “PPPs for the poor”? • ADB (2008)suggests such PPPs would reduce poverty estimates in Asia • for alternative conclusions, see Deaton and Dupriez (2008) • using national CPI to deflate poverty from survey years to IPL series years • especially over periods of relative price shifts • data issues: • a “hole” in the Indian data reflecting methodology changes in NSS 1999 • more broadly, differences in national survey design (e.g. recall period; recall cf diary; number of items in consumption list) and implementation can create significant differences in how consumption is recorded
4: current issues which poverty line to use? • Note that national and international estimates draw on the same data • i.e. data on pc consumption or income, derived from a household survey • what differs is where the poverty line is drawn through this distribution • The international poverty line is a valuable tool for • Comparing levels of absolute poverty between countries • Aggregating national headcounts to track poverty at regional and global levels • Providing standardised national poverty estimates which can be used in cross-country econometric analysis to obtain insights into (for example) the relationships between growth, equality and poverty reduction • However, it is a fairly blunt tool • increasingly sophisticated (greater coverage of countries in the ICP; larger number of household surveys; efforts to construct poverty-specific PPPs;…) • but comparisons over time or between any two countries will still be imprecise • And sometimes not credible • For monitoring and analysing poverty at the national level, almost always better to use a national poverty line
4: current issues capacity and ownership of poverty estimates • ownership issues apply to both and national poverty lines • defining a poverty line and calculating welfare measures are very complex • as much an art as a science • choices are informed by accepted general principles and knowledge of international good practice… • …but there is no blueprint, no single, correct method • the statistical skills required to set a povertyline and estimate the welfare measure may be in very short supply • particularly in low income and / or post-conflict countries,
4: current issues capacity, ownership and donor practice • ownership and capacity problems may be exacerbated by donors • urgent need for data leads to heavy reliance upon expatiate experts • inconsistency in support: responsibility for the survey and / or analysis may pass between donors and / or from one consultant to another • Often very poor archiving of data and documentation on methodology • timing of surveys is driven by supply (donors) rather than domestic demand • Often affects not just analysis • how data is processed to estimate poverty… • …but even what data is collected and with what quality • variations in survey design and implementation • Sometimes, this results in two or more alternative national poverty estimates – in addition to international poverty line estimates • Particularly problematic in post-conflict countries • choices made in the first, baseline survey can constrain later trend analysis
4: current issues challenges in interpreting alternative poverty estimates: estimates for Cambodia currently in circulation
4: current issues monitoring poverty:some basic principles • “If you want to measure change, don’t change your measure” • consistency is critical to analysing trend or monitoring policy impact • periodically updating lines – national or international – will be necessary • but should be infrequent, and done carefully • changes in survey design or poverty methodology should be a matter of inclusive debate (technical choices have political consequences) • and carefully documented • “Not everything that can be counted counts; not everything that counts can be counted” (Albert Einstein) • national poverty measures need to reflect a social and political consensus • need to triangulate poverty line measures with other sources, including qualitative • “I would rather be roughly right than precisely wrong.” (JM Keynes) • look at standard errors and sensitivity • focus on the big questions (is poverty going down or up? Which groups are poorest?) • and choose the combination of measures that best answers these
5: further reading 2008 • “Poverty data: a supplement to World Development Indicators 2008.” in World Bank; 2008 (forthcoming) 2008 World Development Indicators UNDP International Policy Center (ICP) (http://www.undp-povertycentre.org/theme.do) – several short One-Pager notes under the Poverty theme • No. 69 Where the line is drawn: a rejoiner to Ravallion. Thomas Pogge; October 2008 • No. 66 Global poverty reassessed: a reply to Reddy. Martin Ravallion; September 2008 • No. 65The new global poverty estimates – digging deeper into a hole.Sanjay Reddy; September 2008 • No. 54A consistent measure of real poverty: a reply to Ravallion.Thomas Pogge; May 2008 • No. 53Which poverty line? a response to Reddy.Martin Ravallion; May 2008 • “The bottom 1.4 billion” The Economist 28th August 2008. World Bank updates estimates poverty estimates for the developing worldhttp://go.worldbank.org/C9GR27WRJ0 - World Bank page, November 3rd 2008 with summary of new estimates and links to various materials • “The developing world is poorer than we thought, but no less successful in the fight against poverty.” Shaohua Chen and Martin Ravallion; World Bank Policy Research Working Paper 4703; August 2008: http://go.worldbank.org/5V41Z1WRL0 • Briefing notes in English, Chinese, Arabic, French, Spanish and Russian • Press release August 26th • PovcalNet online Poverty Aanalysis Tool http://go.worldbank.org/NT2A1XUWP0 • “Dollar a day revisited.” Martin Ravallion, Shaohua Chen and Prem Sangraula; World Bank Policy Research Working Paper 4602; May 2008: http://go.worldbank.org/7XNUGUDEL0 ADB on “PPPs for the poor” in Asia • Research study on poverty-specific purchasing power parities for selected countries in Asia and the Pacific ADB: March 2008:http://www.adb.org/Documents/Books/Poverty-Purchasing-Power-Parities/Poverty-Specific-PPP.pdf International Comparison Project http://go.worldbank.org/VMCB80AB40 – numerous documents on ICP goals, data collection and analytical techniques; and on poverty PPPs
5: further reading 1998-2007 • Absolute poverty measures for the developing world, 1981-2004. Shaohua Chen and Martin Ravallion; March 2007; World Bank. http://mdgs.un.org/unsd/mdg/Resources/Attach/Capacity/Chen%20&%20Ravallion%20(2007).pdf • “How have the world’s poorest fared since the early 1980s?” Shaohua Chen and Martin Ravallion; fall 2004; World Bank Research Observer. http://mdgs.un.org/unsd/mdg/Resources/Attach/Capacity/Chen%20&%20Ravallion%20(WBRO%202004).pdf • Purchasing power parity for international comparison of poverty: sources and methods. Sultan Ahmad; 2003; World Bank. siteresources.worldbank.org/ICPINT/Resources/poverty_PPP_Data_rev2.doc • “Counting the world’s poor: problems and possible solutions.” Angus Deaton; fall 2001; World Bank Research Observer Vol. 16 No. 2 http://imagebank.worldbank.org/servlet/WDSContentServer/IW3P/IB/2002/01/18/000094946_02010804013046/Rendered/PDF/multi0page.pdf • World Development Report (WDR) 2000/01: attacking poverty. 2001; World Bank; OUP. http://go.worldbank.org/L8RGH3WLI0 • Evaluation of the International Comparison Project (the Ryten Report). UN; 1998.http://unstats.un.org/unsd/methods/icp/8-e.pdf
3: international poverty estimates calculating estimates against the IPL • Convert the IPL ($1.25 pc per day) into the national currency in 2005 using PPPs from the new ICP • Adjust this value to the year(s) for which have survey data for that country using official national CPI data • Note the weights in this index may or may not match well with consumer budget shares at the poverty line • Use this poverty line to generate poverty measures for that year
3: international poverty estimates poverty-specific PPPs? • Two aspects of the problem: • PPPs are based on prices for consumption items in all countries in the ICP: so, developing country prices influenced by OECD consumption baskets • the poor and non-poor may face different prices for the same level of consumption within the same country • Deaton and Dupriez (2008) suggest “PPPs for the poor” may not have much effect on estimates; • However, ADB (2008) has attempted to construct PPPs specific to the goods and service consumed by the poor for a large set of Asian countries (although not China) • And found on balance that these would suggest a lower poverty rate in Asia than would the World Bank’s $1.25 pc per day, 2005 PPP estimates • Ongoing research agenda
4: current issues challenges in interpreting alternative poverty estimates: estimates for Cambodia currently in circulation