Download
1 / 19
190 likes | 320 Views
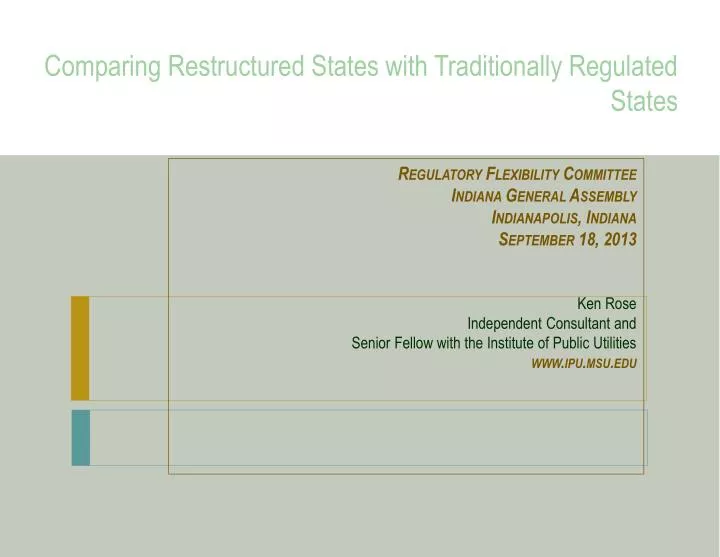
Comparing Restructured States with Traditionally Regulated States. Regulatory Flexibility Committee Indiana General Assembly Indianapolis , Indiana September 18, 2013 Ken Rose Independent Consultant and Senior Fellow with the Institute of Public Utilities www.ipu.msu.edu.

E N D
Comparing Restructured States with Traditionally Regulated States Regulatory Flexibility Committee Indiana General Assembly Indianapolis, Indiana September 18, 2013 Ken Rose Independent Consultant and Senior Fellow with the Institute of Public Utilities www.ipu.msu.edu
Status of State Restructuring Alaska and Hawaii MI: alternative suppliers limited to maximum of 10% of electric utility's retail sales MT: Retail access repealed for customers < 5 MW and for all customers that choose utility service NV: retail access limited to large customers > or = 1 MW, with permission of the PUC OR: nonresidential consumers of PGE and Pacific Power have option to buy electricity from an alternative provider VA: Retail access ended for most customers -- except those >5 MW (w/conditions for return) Allow retail access (13+DC) Retail access suspended (CA) Limited access (5) -- see summary at right; Restructuring law repealed or delayed (4) Not considering restructuring at this time (26) Retail access with generation price control (AZ)
Average retail price of electricity, all sectors, 1960-2011 Data source: DOE/EIA.
Some National Price Trends • Generally, all regions of the country are seeing higher prices since early 2000s • Wholesale prices have fallen since 2008, and been roughly steady since • Restructured state prices increased rapidly from 2002 until 2008, and have since leveled off (small decrease) • For states that still regulate, prices continue to increase, but are still below states that restructured • Can discern no clear and consistent pattern of benefit to consumers from retail access at this time
Weighted annual averages for all states, regulated states and states that ended price caps for residential customers (1990 through June 2013) "Retail Access States": CT, DC, DE, IL, MA, MD, ME, NH, NJ, NY, OH, PA, RI & TX "Regulated States": AL, AR, CO, FL, GA, IA, ID, IN, KS, KY, LA, MN, MO, MS, NC, ND, NE, NM, NV, OK, OR, SC, SD, TN, UT, VT, WA, WI, WV, & WY. Data source: DOE/EIA.
Weighted annual averages for Indiana and neighboring states (1990 through June 2013) Data source: DOE/EIA.
Weighted annual averages for Indiana and neighboring states plus New York (1990 through June 2013) -- Adding New York adds some perspective on Midwest prices
2012 Residential Prices by State (cents/kWh) Data source: DOE/EIA.
Weighted annual averages for all states, non-RTO states and states that ended price caps for residential customers (1990 through October 2012) "Retail Access States": CT, DC, DE, IL, MA, MD, ME, NH, NJ, NY, OH, PA, RI & TX Does RTO versus non-RTO state make a difference? Western non-RTO states: AZ, CO, ID, MT, NM, NV, OR, UT, WA, & WY Southwestern non-RTO states: AL, FL, GA, KY, LA, MS, NC, SC, & TN Data source: DOE/EIA.
Why are most states seeing higher prices (even though fuel prices have been falling)? • Some of the usual suspects . . . • Wholesale market prices? • Declining sales (MWh sold)? • EPA compliance costs? • Fuel costs?
Figure 6. Weighted annual averages for Michigan, neighboring states, regional weighted average, and MISO annual average bilateral price. (1990 through October 2012) Michigan hub price Data source: DOE/EIA.
Why are most states seeing higher prices (continued)? • These factors contribute to higher prices, but don’t seem to explain all the variation • Wholesale market prices from 2002 to 2008 may explain the run-up in retail price; but retail prices have not matched the recent decline in energy prices • Declining sales (MWh sold)? -- after steady growth in the 1990s, sales have been essentially flat or slight declines since 2007 in most of the country, but not sufficient to explain the difference • EPA compliance costs? – more of a coming attraction at this point • Even though natural gas prices have been falling, coal is going in the opposite direction – that may explain some of the price increases • What about new capacity costs? • Not by itself, EIA data shows Indiana increased total capacity by 14.5% between 2000 and 2011; Wisconsin increased total generating capacity by 34.6% during that time; and the US by 29.5%
Costs/Benefits of restructuring versus traditional regulation • We know the predicted benefits from restructuring, including operational efficiencies • lower operating coststhat result from dispatching power plants over the RTO’s region (rather than for each individual utilities’ area) • much of this benefit may be realized in the wholesale market, where power suppliers in Indiana compete in two RTOs now • these markets may not be ideally designed (perhaps they’re over designed), but this is beyond the control of the states to deal with – this lack of state control will be discussed later
Costs/Benefits of restructuring versus traditional regulation (continued) • On the other side of the ledger, additional costs from restructuring may equal or exceed any benefit, additional costs include: • insufficient capital investment in generation and transmission capacity – costly either if we fall short (i.e., loss of reliability) or have to pay for additional incentive structures to attract more investment • a regulated/vertically integrated structure encourages investment • de-integration costs, from loss of vertical economies (from when one decentralized entity supplied all products and services) • additional administrative costs that are passed on to customers • costs all market participants incur to deal with increasing market complexity
State Costs From Restructuring • States that restructured found (to their surprise), that when things go wrong (that is, prices increase rapidly – such as in California, Maryland, New Jersey, etc.), their options are very limited • “Deregulating” at the state level actually transfer jurisdictional authority from the state to the federal regulatory authorities – primarily the Federal Energy Regulatory Commission (FERC) • Unfortunately, when things go wrong within a state or region, customers and other market participants are wholly dependent on the federal government to fix it
Wrapping up . . . • Not saying that one option is clearly worse or better than the other – retail access versus regulation, but • . . . there appears to be no clear benefit for retail customers, unless you look at just the last couple years, with retail choice – and that could quickly change if natural gas prices increase again (as they have in the not too distant past) • cost-based regulation is not perfect, but if the “restructured” model can’t beat it, then something’s wrong • Not always sure what “competition” has to do with what we have been doing the past 20 years • replaced a complex, cumbersome, and expensive regulatory system with a complex, cumbersome, and expensive “deregulatory” system • the current RTO (wholesale markets, such as PJM’s and MISO’s) and retail access-based model (states that have it) is a composite of different markets, that are highly regulated at the federal level and frequently adjusted by FERC and the states • Most of the country is facing the same cost pressures (environmental impact constraints, capacity, flat demand, renewable costs)
Another perspective . . . • Just looking from 2004 through 2012, the average rate of change is not that different between the two groups of states • So, . . . it’s fair to ask, where’s the savings?
Maybe it doesn’t matter what we do . . . because of the under lying economics of the industry Even Texas (yes, Texas) follows the same trend line over the entire time period