Quantitative Reasoning at UMass Boston
180 likes | 379 Views
Quantitative Reasoning at UMass Boston. Fourteen Years of Experience. Mark Pawlak, Director Academic Support and Quantitative Reasoning Programs. General Education at UMass Boston.

Quantitative Reasoning at UMass Boston
E N D
Presentation Transcript
Quantitative Reasoning at UMass Boston Fourteen Years of Experience Mark Pawlak, Director Academic Support and Quantitative Reasoning Programs
General Education at UMass Boston In 2002, a new general education program was put in place after 4 years of faculty discussion and planning with the following principles as its foundation • Critical analysis and logical thought • Verbal and quantitative reasoning • Human diversity • Principal approaches to knowledge Core elements include • Writing--English Composition I & II • First Year & Intermediate Seminar • Mathematics/Quantitative Reasoning • Distribution courses in several areas • Writing Proficiency Requirement • Capstone in major
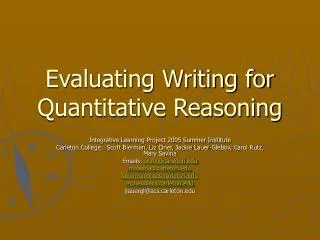
Assessing Student Learning in Quantitative Reasoning: A Dynamic, Evolving Process Mark Pawlak Director, Academic Support and Quantitative Reasoning Programs Chair, Quantitative Reasoning Assessment Committee University of Massachusetts Boston
The Mathematics/Quantitative Reasoning Requirement • All students must “demonstrate competence in mathematics/quantitative reasoning.” • B.S. students must take Calculus I (a traditional Calculus course) • B.A. students have several choices: • Test into PreCalculus or Calculus • Take Statistics (taught by Math, Psychology, Sociology, Economics, etc.) • Take College Algebra • Take a Quantitative Reasoning course • Each semester, approximately 200 - 250 students choose a QR course.
Quantitative Reasoning Courses Math 114Q Mathematics offers the primary QR course This is the lowest-level course Math offers Prerequisite: (outdated) placement test All sections are taught in a computer lab QR faculty are primarily adjuncts (90%) Class size is small (20 - 23 students) Many students come out of developmental math courses and are math phobic; have weak skills; hate math All topics are motivated using real world data, course follows an investigations pedagogy Technology is used as a tool and as way of seeing patterns. QR Course Guidelines Required topics are: descriptive statistics linear models exponential models and/or probability use of technology (graphing calculators or computers) Students learning outcomes: engage in critical reading and analysis speak, listen and write effectively use technology to further learning work independently and collaboratively reason logically and quantitatively
Student self-assessment Self-reflection: • Students complete an “automathography” at the beginning of the semester and a reflection at the end of the semester – this is viewed only by the instructor Course assessment and evaluation: • Student questionnaire given to all students • Demographic data • Self-assessment of technical skills and QR skills • Attempts to measure attitudinal change • Administered online with support from the mathematics department • Faculty log in to view their students’ responses and course-wide responses.
Faculty self-assessment • QR faculty meet each semester to “de-brief” • Discussions include • What worked • What didn’t work • Issues of support and training • Student learning outcomes and course objectives • Assessment information • Resources and information
Holistic grading of common final exam problems • QR faculty agree on a set of problems that will appear on all finals across sections • Generally 5-6 problems, covering main student learning outcomes • After semester grades have been submitted a sample of finals from each section is graded holistically • Initially, holistic grading was done by QuAC members • QR faculty now participate in the holistic grading • End of semester QR faculty debriefing and holistic exam grading are now combined.
Sample Exam Question • On April 19, 2012, the Boston Globe reported that “MIT physicist leads effort to scrap the penny. Finds himself at center of passionate debate about coin,” (http://www.bostonglobe.com/business/2012/04/18/mit-physicist-jeff-gore-leads-effort-scrap-penny/Xz04E54R4BTkoDTYIOpnJO/story.html ) • “[Jeff] Gore, who has become an unlikely national spokesman for efforts to eliminate the penny, is gaining fresh hope that the United States might finally dump the coin. Canada recently announced it would get rid of its one-cent piece by the end of the year even as the US Mint reported it is losing more money than ever to produce the coin.. • The following graphs are from the article:
Question: The print version of the article noted that in 2011 there were 4,289 million pennies shipped. Confirm that this number of pennies is consistent with the 2011 data from the two graphs below .
Common Final Exam sample problem 2 1. An article about the US Postal Service in the New York Times on December 4, 2011stated that First-class mail — items like bills and letters that require a 44-cent stamp — fell 6.6 percent in 2010 alone, continuing a five-year-long plunge. Last year … there were 9.3 billion pounds of ‘standard mail’ — the low-cost postage category available to mass advertisers — but only 3.7 billion of first-class mail. www.nytimes.com/2011/12/04/sunday-review/the-junking-of-the-postal-service.html) a. A graphic next to the article said that standard mail in 2010 amounted to 30.3 pounds for every adult and child in the US. Verify this 30.3 pounds per person figure. b. How many pounds of first class mail did the Post Office deliver in 2009? c. First class mail mostly consists of bills, credit card statements, personal letters and greeting cards. First class postage is 44 cents for the first ounce and 20 cents for each additional ounce. Estimate the total cost of the postage on first class mail in 2010.
Outcomes:What we have learned • Students appreciate how math (algebra) can be meaningful in the real world • Students gain proficiency in using Excel and value it for use in future coursework & employment • Student develop habit of Internet searching (primarily Google) and back-of-the-napkin problem solving to verify data claims and apply this to other contexts • Faculty uniformly address QR topics and competencies with varied emphasis • Some mathematics topics remain challenges for teaching and learning
Assessing QR Assessment Lessons Importance of continual evolution and refinement of instruments and methods Adequate resources for faculty release time & administrative support are needed to conduct assessment; collect and analyze data Importance of faculty involved in modifying course/program based on results of assessment Challenges Timely compilation of common final exam Timely administration of questionnaire Conducting timely holistic grading; assessing results and discussing with faculty Faculty buy-in to course and program modifications based on assessment
Some new initiatives & goals at UMass Boston • Recruiting statistics faculty from relevant majors and all colleges to QUAC to review alignment of MA 114Q with their courses • Developing appropriate placement instruments for MA 114Q and for statistics • Collaborating with Carnegie Foundation Statway and Quantway initiatives to accelerate developmental math coursework • Recruiting STEM science faculty to embed relevant QR assignments in their courses • Using the QR VALUE rubric to complement current holistic assessment of student learning in MA 114Q
Resources Numeracy article: QRCW Rubrics http://scholarcommons.usf.edu/numeracy/vol4/iss2/art8/ • SIGMAA on Quantitative Literacy: http://sigmaa.maa.org/ql/ • Common Sense Mathematics (UMass Boston) http://quantitativereasoning.net/ See also: • “Quantitative Reasoning at the University of Massachusetts Boston,” M. Mast and M. Pawlak, in Current Practices in Quantitative Literacy, edited by R. Gillman, MAA publications, 2006 Contacts: • mark.pawlak@umb.edu • maura.mast@umb.edu