Download
1 / 6
240 likes | 832 Views
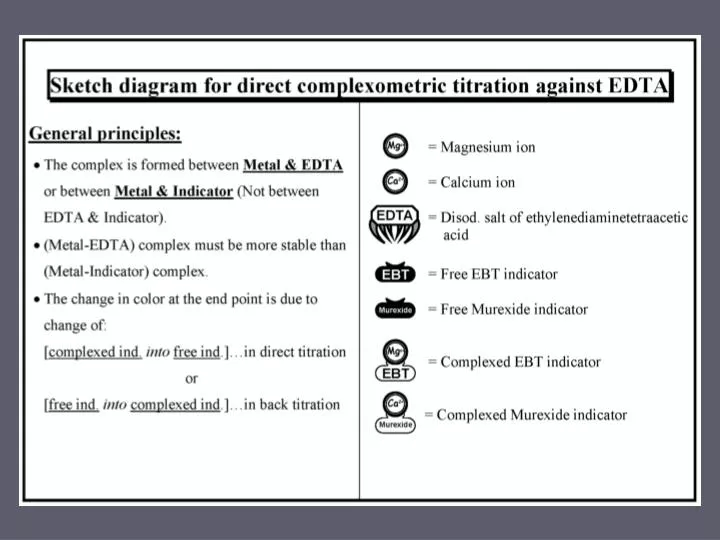
Pictures. Summary of the Color Changes for the titration of Mg 2+ EDTA using EBT ind. Note: Actual colors in the lab may vary somewhat from what is shown. These pictures are intended as a rough guide only. . End Point ) Blue). Before starting titration & During titration

E N D
Summary of the Color Changes for the titration of Mg2+ EDTA using EBT ind. Note: Actual colors in the lab may vary somewhat from what is shown. These pictures are intended as a rough guide only. End Point )Blue) Before starting titration & During titration (Wine Red) Just before the end point (Wine Red+Blue) After the end point (still Blue)
Summary of the Color Changes for the titration of Ca2+ EDTAusing murexide ind. Note: Actual colors in the lab may vary somewhat from what is shown. These pictures are intended as a rough guide only. Just before the end point (Rose Red + Bluish Violet) Before starting titration & During titration (Rose Red) After the end point (still Bluish Violet) End Point )Bluish Violet)