Mathematics and Physics
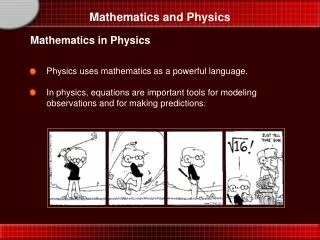
Mathematics and Physics. Mathematics in Physics. Physics uses mathematics as a powerful language. In physics, equations are important tools for modeling observations and for making predictions. Mathematics and Physics. Dimensional Analysis.

Mathematics and Physics
E N D
Presentation Transcript
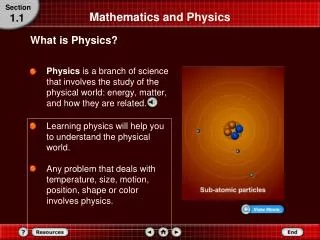
Mathematics and Physics Mathematics in Physics • Physics uses mathematics as a powerful language. • In physics, equations are important tools for modeling observations and for making predictions.
Mathematics and Physics Dimensional Analysis • Choose a conversion factor that will make the units cancel, leaving the answer in the correct units. • For example, to convert 1.34 kg of iron ore to grams, do as shown below:
Mathematics and Physics Significant Digits • A meterstick is used to measure a pen and the measurement is recorded as 14.3 cm. • This measurement has three valid digits: two you are sure of, and one you estimated. • The valid digits in a measurement are called significant digits.
Mathematics and Physics Significant Digits • All nonzero digits in a measurement are significant, but not all zeros are significant. • Consider a measurement such as 0.0860 m. Here the first two zeros serve only to locate the decimal point and are not significant. • The last zero, however, is the estimated digit and is significant.
Mathematics and Physics Significant Digits • When you perform any arithmetic operation, it is important to remember that the result never can be more precise than the least-precise measurement. • To add or subtract measurements, first perform the operation, then round off the result to correspond to the least-precise value involved. • To multiply or divide measurements, perform the calculation and then round to the same number of significant digits as the least-precise measurement.
Section Check Question 1 The potential energy, PE, of a body of mass, m, raised to a height, h, is expressed mathematically as PE = mgh,where g is the gravitational constant. If m is measured in kg, g in m/s2, h in m, and PE in joules, then what is the unit s of 1 Joule? • 1 kg·m/s • 1 kg·m/s2 • 1 kg·m2/s • 1 kg·m2/s2
Section Check Answer 1 Answer:D Reason:
Section Check Question 2 A car is moving at a speed of 90 km/h. What is the speed of the car in m/s? (Hint: Use Dimensional Analysis) • 2.5×101 m/s • 1.5×10³ m/s • 2.5 m/s • 1.5×10² m/s
Section Check Answer 2 Answer:A Reason:
Section Check Question 3 Which of the following representations is correct when you solve 0.030 g + 3333 g? • 3.4×10³ g • 3.36×10³ g • 3×10³ g • 3333 g
Section Check Answer 3 Answer:D Reason:0.030 goes to the thousandths place but 3333 only goes to the ones place. The final answer must be rounded to the ones place.
Graphing Data Linear Relationships • When the line of best fit is a straight line, as in the figure, the dependent variable varies linearly with the independent variable. This relationship between the two variables is called a linear relationship. • The relationship can be written as an equation.
Graphing Data Linear Relationships • The slope is the ratio of the vertical change to the horizontal change. To find the slope, select two points, A and B, far apart on the line. The vertical change, or rise, Δy, is the difference between the vertical values of A and B. The horizontal change, or run, Δx, is the difference between the horizontal values of A and B.
Graphing Data Linear Relationships • As presented in the previous slide, the slope of a line is equal to the rise divided by the run, which also can be expressed as the change in y divided by the change in x. • If y gets smaller as x gets larger, then Δy/Δx is negative, and the line slopes downward. • The y-intercept, b, is the point at which the line crosses the y-axis, and it is the y-value when the value of x is zero.
Graphing Data Nonlinear Relationships • The graph shown in the figure is a quadratic relationship. • A quadratic relationship exists when one variable depends on the square of another. • A quadratic relationship can be represented by the following equation:
Graphing Data Nonlinear Relationships • This is an example of an inverse relationship. • In an inverse relationship,a hyperbola results when one variable depends on the inverse of the other. • An inverse relationship can be represented by the following equation:
Section Check Question 1 Which type of relationship is shown following graph? • Linear • Inverse • Parabolic • Quadratic
Section Check Answer 1 Answer:B Reason:In an inverse relationship a hyperbola results when one variable depends on the inverse of the other.
Section Check Question 2 What is line of best fit? • The line joining the first and last data points in a graph. • The line joining the two center-most data points in a graph. • The line drawn close to all data points as possible. • The line joining the maximum data points in a graph.
Section Check Answer 2 Answer:C Reason:The line drawn closer to all data points as possible, is called a line of best fit. The line of best fit is a better model for predictions than any one or two points that help to determine the line.
Section Check Question 3 Which relationship can be written as y = mx? • Linear relationship • Quadratic relationship • Parabolic relationship • Inverse relationship
Section Check Answer 3 Answer:A Reason:Linear relationship is written as y = mx + b, where b is the y intercept. If y-intercept is zero, the above equation can be rewritten as y = mx.