Decision and Causality
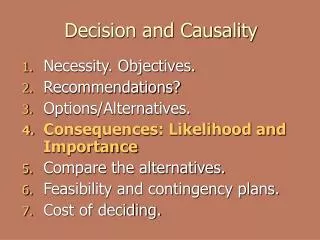
Decision and Causality. Necessity. Objectives. Recommendations? Options/Alternatives. Consequences: Likelihood and Importance Compare the alternatives. Feasibility and contingency plans. Cost of deciding. Decision and Causality. Evaluate causal models

Decision and Causality
E N D
Presentation Transcript
Decision and Causality • Necessity. Objectives. • Recommendations? • Options/Alternatives. • Consequences: Likelihood and Importance • Compare the alternatives. • Feasibility and contingency plans. • Cost of deciding.
Decision and Causality Evaluate causal models Based on Giere, Understanding Scientific Reasoning, 4th ed, 1997
Decision and Causality Evaluate causal models Does saccharin cause cancer?
Decision and Causality Evaluate causal models Does saccharin cause cancer? Experiment on rats fed on 5% saccharin for 2 generations.
Decision and Causality Evaluate causal models Does saccharin cause cancer?
Decision and Causality Significance: probability of this deviation from expected value by chance alone.
Decision and Causality Does saccharin cause cancer? Yes, but in rats and in high doses. However, could have small effect in humans.
1st Generation Hypothetical sample Saccharin Hyp. All C (X) Modelling the experiment F(E)=7/78 Random Real Pop (U) Random P=7,5% 152 Random Hyp.. No C (K) No saccharin Hypothetical sample F(E)=1/74
2nd Generation Hypothetical sample Saccharin Hyp. All C (X) Modelling the experiment F(E)=14/94 Random Real Pop (U) Random P=0,3% 183 Random Hyp.. No C (K) No saccharin Hypothetical sample F(E)=0/89
Randomized experimental design, RED Take random sample from real population. Split and randomly assign cause to a group. This group functions as a sample of the hypothetical population X (eXperimental) The other group functions as a sample of the hypothetical population K («Kontrol») Modelling the experiment
Can we do this with people?... Modelling the experiment
Can we do this with people?... In 1747, James Lind carried out a controlled experiment to discover a cure for scurvy. (from http://en.wikipedia.org/wiki/Design_of_experiments) Modelling the experiment
Lind selected 12 men from the ship, all suffering from scurvy, and divided them into six pairs, giving each group different additions to their basic diet for a period of two weeks. The treatments were all remedies that had been proposed at one time or another. Modelling the experiment
cider elixir vitriol seawater garlic, mustard and horseradish vinegar two oranges and one lemon every day. Modelling the experiment
Can we do this with people?... It depends on the issues. Ethical concerns may prevent this approach (cannot force people to smoke, for example) Modelling the experiment
For human testing it is also important to use blinded or double blinded experiments: Blinded: The subjects do not know to which group they belong Double-blind: Neither the subjects nor the evaluators know to which group each subject belongs. Modelling the experiment
Double-blind studies are least susceptible to bias (the experimenter wants some result, placebo effect, etc) Modelling the experiment
One alternative: Prospective study. Select individuals based on the presence or absence of the possible cause (e.g. smokers and non-smokers) Wait, and check for the correlation of the effect with the possible cause. (a “time delay” correlation…) Modelling the experiment
Framingham study: In 1950, selected 3074 men and 3433 women at random, ages 30-59. Examined every 2 years for 20 years. Coronary Heart Disease (CHD) at ages 40-49: Men: 29% Women: 14% Model of Prospective Study
Framingham study: Controlling for other factors Coronary Heart Disease (CHD) at ages 40-49: Men: Smoking: 22% Non-S:11% Women: Smoking: 7% Non-S:6% Model of Prospective Study
Framingham study: Controlling for other factors Coronary Heart Disease (CHD) at ages 40-49: Coffee drinkers also had significantly more CHD than non-drinkers. Could it be correlation with tobacco? Model of Prospective Study
Framingham study: Controlling for other factors Coronary Heart Disease (CHD) at ages 40-49: Coffee drinkers also had significantly more CHD than non-drinkers. Could it be correlation with tobacco? Model of Prospective Study
Framingham study: Controlling for other factors Coronary Heart Disease (CHD) at ages 40-49: Coffee drinkers also had significantly more CHD than non-drinkers. Nonsmokers had no difference in CHD as a function of coffee drinking. Model of Prospective Study
Men aged 30-39 Frequency of E Model of Prospective Study Farmingham X fx(CHD)=22% Smokers Nonsmokers Random K fk(CHD)=11% All C No C Nonrandom
A prospective study (or experiment) examines the correlation between two factors, but the possible cause is chosen before the effect is evident. There may be effects from other factors, but these can be accounted for, and a prospective study can be quite conclusive Model of Prospective Study
Example: 1960s, National Cancer Institute (USA) 37,000 smokers and 37,000 nonsmokers After 3 years smokers had Double death rate Double death rate from heart disease Nine times death rate from lung cancer Correlated with time, amount, inhalation Decreased death rate for former smokers Model of Prospective Study
A different approach: Breast cancer and contraception In the 1980s, UK researchers questioned women who had breast cancer and were younger than 36 years old. 755 responded. For each of these women researchers selected one woman at random with no breast cancer. Modelling the experiment
A different approach: Each woman was interviewed about children, marriage, cohabitation, oral contraceptives, etc. Modelling the experiment
Results: Women using oral contraceptives for more than 4 years Modelling the experiment
A retrospective study: Selects sample based on the effect and tries to reason backwards towards cause. Most susceptible to bias. In this case: Response Surveillance Recall Interview Modelling the experiment
Response bias: Only some women agreed to participate, and this may not be a random sample Surveillance: Women using contraceptives go to the doctor more often Modelling the experiment
Recall: Subjects may not remember past events accurately, or may have a biased memory. Interview: Interviewers knew Modelling the experiment
Results: Women using oral contraceptives for more than 4 years Modelling the experiment
Frequency of C Model, Retrospective Study Women UK X fx(OC-22)=68% Cancer No cancer Match? K fk(OC-22)=69% All E No E Nonrandom
Evaluate the model • Model and Population • Sample Data • Experimental design • Random Sampling and bias • Significance • Summary and conclusion
Decision and Causality Decision is related to causal models: Because we need to understand the effects our decisions will cause, and Because we need to decide which experiments to do to test causal models
Designing an experiment • Necessity. Objectives. • Recommendations? • Options/Alternatives. • Consequences: Likelihood and Importance • Compare the alternatives. • Feasibility and contingency plans. • Cost of deciding.
Designing an experiment Examples: Second hand smoking causes cancer? • Necessity: important to determine effect • Recommendations? Similar to smoking? • Options: RED, Prospective, retrospective • Consequences: RED may be unethical, prospective takes too long… • Compare: Retrospective • Feasibility: Feasible • Cost of deciding: …
Designing an experiment Examples: Does birth date affect personality (according to astrology)? • Necessity: not much… • Recommendations? No… • Options: RED, Prospective, retrospective • Consequences: No bad consequences, RED is most reliable • Compare: Best is double blind RED • Feasibility: Double blind may not be feasible. • Cost of deciding: …
Designing an experiment Examples: Shawn Carlson, 1989 http://psychicinvestigator.com/demo/AstroSkc.htm 30 astrologers were asked to match 116 natal charts each to one of 3 personality profiles (using the California Personality Inventory, with the agreement of the astrologers)
Designing an experiment Examples:
Designing an experiment Examples: Does birth date affect personality (according to astrology)? In this case we do not test the actual causal model of birth date and personality. But the absence of a correlation between the astrologers’ predictions and CPI shows there is no causal relation between the factors identified. A causal relation implies a correlation.
Consequences Consequences are an important part of any decision. Decisions under uncertainty: consequences must be weighted with the probability.
Consequences Example: 0.3% probability of child having Down’s if mother over 35 0.5% probability of miscarriage from amniocentesis. Is it worth the risk? It depends on the utility values…
Consequences Example: Biofuel may reduce carbon emissions by a small fraction (industrialized agriculture demands lots of fuel). However, crops used for fuel will raise food prices globally.
Consequences Example: Biofuel may reduce carbon emissions by a small fraction (industrialized agriculture demands lots of fuel). However, crops used for fuel will raise food prices globally. Lowering consumption could be an answer. But what is the cost of decreased economic growth?