Download
1 / 14
140 likes | 290 Views
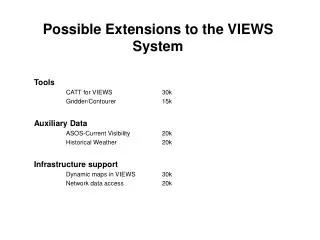
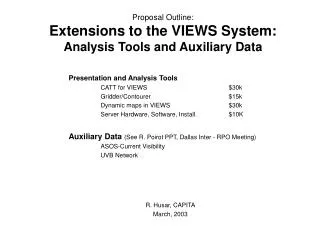
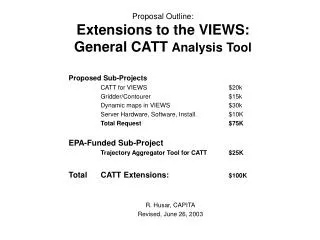
Proposal Outline: Extensions to the VIEWS: General CATT Analysis Tool. Proposed Sub-Projects CATT for VIEWS $20k Gridder/Contourer $15k Dynamic maps in VIEWS $30k Server Hardware, Software, Install. $10K Total Request $75K EPA-Funded Sub-Project

E N D
Proposal Outline:Extensions to the VIEWS:General CATT Analysis Tool Proposed Sub-Projects CATT for VIEWS $20k Gridder/Contourer $15k Dynamic maps in VIEWS $30k Server Hardware, Software, Install. $10K Total Request $75K EPA-Funded Sub-Project Trajectory Aggregator Tool for CATT $25K Total CATT Extensions: $100K R. Husar, CAPITA Revised, June 26, 2003
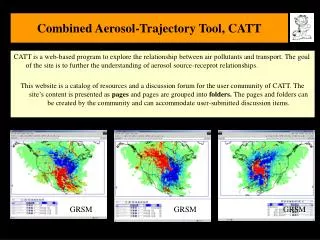
CATT for VIEWS and other Aerosol Datasets Background: A combined aerosol trajectory aggregation tool, CATT, has been developed for easy aggregation and browsing of airmass histories associated with specific aerosol conditions. The CATT tool, is now supported (MANEVU/MRPO) for 16 stations and for pre-calculated residence times. Proposal: We propose to extend the CATT tool by allowing the use of the entire VIEWS chemical database and other remotely accessible datasets to set the aerosol filter conditions. Budget: $20k Implementation and Status: The technologies or remotely accessing the VIEWS and other databases and performing chemical filtering queries to VIEWS has been tested for feasibility. The prototype CATT tool for 16 sites is now in beta testing by the MANEVU/MRPO group. This extension to CATT has was option on the contract but funds were not available. R. Husar will lead this effort in close cooperation with B. Schichtel of CIRA/VIEWS. Deliverables: The main deliverable of this sub-project is a fully functioning CATT aerosol transport anlysis tool applicable to the entire VIEWS database as well as to other chemial/trajectory data pairs. It is assumed that the companion Trajectory Aggregation Tool, TAT, will be developed under an EPA small grant.
Extending CATT to VIEWS ‘On the fly trajectory aggregation for 150+ VIEWS sites (supported by EPA- CATT-TAT) Proposed Extension to VIEWS Current MANEVU/MRPO Project 16 sites 180+ VIEWS sites over the entire US; 100+ ‘species’ 15 ‘species’
CATT Tool Implementation • Further information about CATT is available , including tesing. • The tool displays the incremental transport probability for specified query conditions Combined Aerosol Trajectory Tool - CATT Query Conditions
Spatial Interpolation and Rendering Tool for VIEWS Background: A tool for transforming point measurement data to a continuous surface would aid the analysis of VIEWS data and their comparison with other data from monitoring, emissions, satellite as well as with model results Proposal: We propose to incorporate spatial interpolation and rendering facilities into the Dvoy data access and browsing system. The Gridder/Contourer tool will be applicable to the spatial datasets in VIEWS as well as from other monitoring networks. Budget: $15k Implementation and Status: The gridder/contourer technology has been developed at CAPITA over the past 15 years. Stefan Falke, who did his PhD dissertation on spatial interpolation will lead the effort. Deliverables: The deliverable of this sub-task is is a web-based Gridder/Contourer that can access VIEWS to retrieve spatial point measurement data and perform advances spatial interpolations. The outputs from the Gridder/Contoures will be suitable for import into GIS and other processing/rendering software.
Spatial Interpolation Settings Interpolate PM25 Conc. Contour Rendering Grid PM25 PM25 Conc. Spatial Interpolation and Rendering Point Rendering The spatial interpolation operator transforms a data table to a gridded map using nearby measurement data. The gridding and contouring of the selected data is done ‘on the fly’ by the user
Gridding: Accounting for Data Density The advanced spatial interpolation algorithm accounts for the variations in point data density inherent in air quality monitoring networks. The resulting interpolated estimates are more representative of the urban and rural differences in air pollutant concentrations. Low Point Data Density High Point Data Density
Rendering: Rectangular, Contour, Lines A flexible display rendering of gridded data will be implemented to accommodate different applications. The flexibility enables clearer presentation and easier comparison with other data. Contoured Grid Lines Rectangular Grid Cells Contoured Grid Cells
Dynamic Maps for VIEWS Background: The Visibility Information Exchange Web System, VIEWS is an online exchange of visibility data, research, and ideas to support the Regional Haze Rule. The VIEWS system also provides spatio-temporal summaries of key haze parameters. Proposal: We propose to enhance the current image-based VIEWS spatial data delivery system by a dynamic mapping module for flexible presentation of spatial data. Budget: $30k Implementation and Status: The Voyager data browser has a flexible mapping module that can be incorporated into the VIEWS delivery system. For the past year, B. Schichtel of CIRA/VIEWS and R. Husar/CAPITA have been planning the mapping module transfer but the resources were not available. Deliverables: A web-based program to access VIEWS data, dynamically render the data as points or contours, and overlay the VIEWS data on geographic and temporal data layers for other providers.
VIEWS and ‘Voyager’ Data Presentation • VIEWS data summaries are mostly pre-calculated • The spatial images are pre-rendered and saved • The data layers, zoom, labels etc are set • Voyager accesses most data from the database • The spatial images are generated at use time • Data layers, zoom, labels etc are set by user
Superposition of VIEWS and other Data with Dynamic Mapping Global Aerosol Model Satellite Reflectance Digital Elevation Satellite Aerosol Optical Depth
Auxiliary Data VOYGER Browser Software Replication Data Replication Analysis & Aux. Data Viewer VIEWS & Auxiliary Data Analysis Tools & Delivery VIEWS Extensions Data Replication VIEWS Viewer VIEWS Business Logic VIEWS Data CATT Server Hardware and VIEWS Connectivity Server hardware and software for the delivery of the above Budget: $10K CAPITA Server Proposed CATT server connected to CIRA and CAPITA CIRA Server
Schedule • Project Period: September 2003 – June 2004 • Begin CATT-Views testing: December 2003 • Public Testing: March-June 2004 • Project Completion: June 30, 2004
Budget and Schedule by Task • Combined Aerosol Traj. Tool (CATT) $30K Sep 1, 2003 – Jan 1, 2004 • Spatial interpolation (gridding) tool $15K Sep 1, 2003 – Mar 1, 2004 • Dynamic mapping for VIEWS $30K Jan 1, 2004 – Jun 1, 2004 • Server hardware and software $10K Jan 1, 2004 – Aug 1, 2004