Food deserts
260 likes | 735 Views
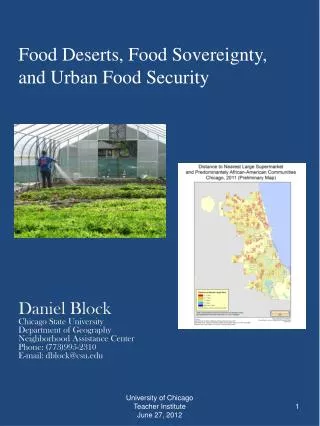
Food deserts . Lori Kowaleski-Jones Department of Family and Consumer Studies University of Utah. Food Desert. Broadly conceptualized as limited access to affordable and nutritious foods, particularly in low income areas. Food Environment and Health.

Food deserts
E N D
Presentation Transcript
Food deserts Lori Kowaleski-Jones Department of Family and Consumer Studies University of Utah
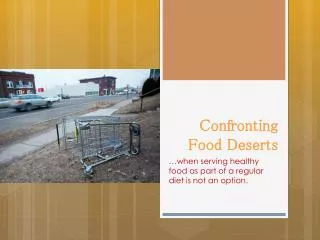
Food Desert • Broadly conceptualized as limited access to affordable and nutritious foods, particularly in low income areas
Food Environment and Health • Overweight increasing in the United States • Recent research has linked food environments to health • 2008 Farm Bill called for information about the identification of food deserts • But how to define…
USDA Food Desert Definition • defines a food desert as a low-income census tract where a substantial number or share of residents has low access to a supermarket or large grocery store: • To qualify as a “low-income community,” a census tract must have either: • 1) a poverty rate of at least 20% OR • 2) a median family income at or below 80 % of the area's median family income; • To qualify as a “low-access community,” • at least 500 people and/or at least 33 % of the census tract's population must reside more than one mile from a supermarket or large grocery store • (for rural census tracts, the distance is more than 10 miles).
Alternate definitions • Does it have to be low income areas? • Are deserts mirages? Estimates suggest that only 15% of people shopped for food within their own census area. • Should the focus be on supermarket? • (what about smaller retailers and farmers markets?)
Research on Food Deserts in SLC • Coauthors are Jessie Fan, Ikuho Yamada, Barbara Brown, Ken Smith and Cathleen Zick. • Different data sets have been used—do they have comparable information? • Variety of geographic scales to describe local food environment and the methods used to describe distance • Our study was an initial assessment of how sensitive the analyses are to these issues
Our Study • Assess the comparability of data from • Reference USA • Dun and Bradstreet • Roughly, about a 1/3 of the records in each data set are unique • Research results can only be as good as the data used • 564 census block groups
Research Aims • Where? Explore variation with different data sets to measure food deserts and their prevalence in Salt Lake County • Compare “all grocery stores” (GS) to “large grocery stores” (LGS) • Simple in-out measure vs. 1-km radius buffer measure • Who? Use multivariate analysis to relate demographic characteristics and built environment factors to the likelihood that a census block group will be a food desert. • Low income only? Incorporate an economic component to the definition of food deserts
All Grocery Store (GS) and Large Grocery Store (LGS) Counts in Salt Lake County: by Data Source & Sales Volume
Alternative Definitions of Food Deserts • Dichotomous measure, 1= BG (Block Group from census) contains any grocery store • Dichotomous buffer measure captures whether a BG is covered by any 1km buffer of grocery stores • 1km buffer continuous measure: percentage of the BG land area that is not covered by the 1km grocery store buffer • These three measures are repeated for large grocery stores (sales volume > = million) • These measures are repeated for whether the above is in a low income (median household income < 25th percentile for the county) or higher income BG
R=1km R=1km R=1km Census Block Group Food Outlet A Food Outlet B Food Outlet C
dichotomous with large grocery stores only dichotomous with all grocery stores Buffer-based dichotomous with all grocery stores Buffer-based dichotomous with large grocery stores only
Results Aim #1 • Using the most basic definition, 73% of Salt Lake County BG is a food desert; higher when only large grocery stores are considered • Using the 1 km circular buffer definition, much smaller estimate of food deserts; variation across data sets; variation even more distinct when large grocery stores are considered
Demographic Characteristics and Built Environment • Ave. residents per sq. mile (density, BG) • Ave. intersections w/in ¼ mile of residence (design, BG) • Ave of (1999 – Median Yr. Built) (design, CT) • Within the Block Group, the proportions of • African Americans • Hawaii and Pacific Islanders • Asians • Hispanics
Odds ratios for BG not covered by 1 km circular buffer of any grocery store (GS) and not covered by large grocery store (LGS)
Results Aim #2 • Little variation across data sets • Little variation across size of grocery store • Overall, BG that have older housing stock, greater intersection and population density have lower odds of being food deserts • BG with higher median family income are more likely to be food deserts
Aim #3: Low income only? Separate Analyses for lower income and higher income CBGs
Results Aim #3 • Overall, similar associations between demographic characteristics and odds of non coverage across income level of BG—exceptions • In lower income BGs, higher proportion of Hispanics predicts lower odds for FD, whereas in higher income BGs, higher proportion of Hispanics predicts higher odds for FD • In lower income BGs, higher median income predicts lower odds for FD, whereas in higher income BGs, higher median income predicts higher odds for FD
Discussion • Aim #1: variation across data sets in identification of food deserts • Future research and policy activity should be careful to appreciate the limitations of data used to define and identify food deserts. • Recommendation: If the focus is to identify FD for policy implementation, more detailed measurements and multiple data sets give a more comprehensive picture. • Aim #2: limited variation across data sets in estimating correlates of food deserts • Surprising, given the lack of agreement across data sets • Recommendation: If the focus is to estimate correlates of food deserts, employing a single data source seems to be fine. • Aim #3: some variation in direction of odds ratios across income specification • Preliminary and likely proxying for more complicated processes • Recommendation: future research incorporate economic dimensions in food desert research.
Implications • Controversy that there has been a dearth of evidence linking food deserts to dietary health. Consensus that improving access might not change consumer behavior. Patterns might persist, role of preferences and prices.
Food Deserts and Public Policy • Recent activity has been the Healthy Food Financing Initiative 2010 with the aim of eliminating food deserts • More information on spatial elements of food environment • http://www.ers.usda.gov/FoodAtlas/ • http://www.ers.usda.gov/data/fooddesert/