Download
1 / 14
140 likes | 276 Views
Correlative Analysis of PMC Existence and Mesospheric Temperature and Water Vapour. A.G. Feofilov 1,2 , S.V. Petelina 3 , A.A. Kutepov 1,2 , W.D. Pesnell 1 , and R.A. Goldberg 1. 1 – NASA GSFC, Greenbelt, MD, USA 2 – Catholic University of America, Washington, DC, USA

E N D
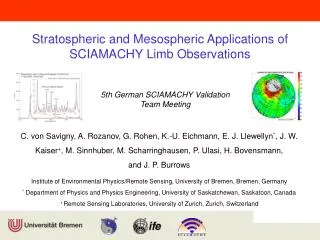
Correlative Analysis of PMC Existence and Mesospheric Temperature and Water Vapour A.G. Feofilov1,2, S.V. Petelina3, A.A. Kutepov1,2, W.D. Pesnell1, and R.A. Goldberg1 1 – NASA GSFC, Greenbelt, MD, USA2 – Catholic University of America, Washington, DC, USA 3 – La Trobe University, Victoria, Australia LPMR workshop, Stockholm, Sweden, July 12 – 15, 2009
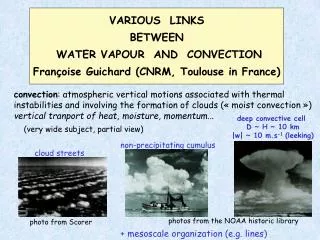
Water vapor, temperature and PMCs Tfrost Water vapor Precipitatingice particles Sublimated ice = enhanced H2O
Outline • General idea: trace the PMC/T/H2O correlations • Instruments: OSIRIS/Odin and SABER/TIMED • “Climatological” and “instantaneous” approaches • Coincidence criteria for instantaneous profiles • Separating the tangent-point from near/far field observations • PMC – mesopause temperature correlations • PMC – water vapor correlations • Conclusions
The OSIRIS Instrument Aboard the Odin Satellite Odin satellite: polar, sun-synchronous, near terminator ~600 km orbit. Scan modes: 6–60 km, 6–100 km, and 60–100 km.Operates since 2001. OSIRIS: Optical Spectrograph and InfraRed Imager System. Spectral range: 280–810 nm Spectral resolution: 1 nm Exposure time: 2–5 s Vertical resolution: 1.3–2 km (mesospheric scan mode)
The SABER Instrument Aboard the TIMED Satellite TIMED: Thermosphere, Ionosphere, Mesosphere Energetics & Dynamics 74.1° inclined 625 km orbit; Latitudinal coverage: 83°S–52°N / 53°S–82°N Data available since 25 January 2002 • SABER: Sounding of the Atmosphere Using Broadband Emission Radiometry • Limb scanning infrared radiometer (~10–100 km, ~2 km footprint) • 10 broadband channels (1.27–17 µm) • Products: kinetic temperature, pressure, CO2, O3, H2O, NO, O2, OH, O, H
Climatological approach • Zonal averages of T and PMCs. H2O not included. • 6 latitudinal “belts”: 55S–65S, 55N–65N, 65S–75S, 65N–75N, 75S–85S, and 75N–85N. • Tracing correlation of: - mesopause temperature vs PMC occurrence rate - mesopause altitude vs PMC peak height • Daily averages with 7 day sliding window smoothing
Preliminary discussion • Clear anti-correlation between the Tmesop and PMC occurrence rate. • A unusually warm polar mesospheric summer 2002 is better traceable in PMC occurrence rates at 65N–75N. • Averaged (Tmesop vs PMC occurrence rate) correlations for NH and SH overlap at temperatures above 132 K. • At lower temperatures the saturation in NH is reached at ~123 K while in SH it is reached at ~126 K mesopause temperature.
Instantaneous profiles comparison approach:coincidence criteria and profile selection • “Overlapping weight” for each coincidental pair of scans: = t × 4 + ×5 + × 1 +6 / ( 90 z )t: time, : lat, : lon, z : SZA • Excluding the scans with: t > 1 hour, > 4, >20, z > 89 • 1083 overlapping measurements in 2002–2008. • Additional filtering: “invisible” PMCs (not observed or non-existent): ~50% and near/far field PMC observations: another ~50% out of remaining 50%.
Near/far field and tangent point PMCs 100 km along the line-of-sight: 1km200km: 4 km vertical offset
Conclusions • Observed correlations between T, H2O and PMC correspond to our current understanding of the physics of the region: • Anticorrelation between Tmesop and PMC occurrence rate. • Correlation between integrated height of (T<Tfrost) area and PMC brightness. • Correlation between H2Oundercloud/H2Ocloud and PMC bright- ness is a signature of freeze-drying and cloud sublimation. • Significant number (~50%) of PMC observations come from near/far field – important for future analysis.