Download
1 / 38
400 likes | 532 Views
General Water Quality Facts. Less than 1% of the earth's total water supply is suitable for drinking. Dirty water kills 5,000 children per day (United Nations, 2006) and 3 million per year globally.

E N D
General Water Quality Facts • Less than 1% of the earth's total water supply is suitable for drinking. • Dirty water kills 5,000 children per day (United Nations, 2006) and 3 million per year globally. • 44% of streams, 64% of lakes, and 30% of bays assessed are not clean enough to support uses such as fishing and swimming. (US EPA, 2011) • Every day, 2 million tons of sewage and industrial and agricultural waste are discharged into the world’s water. (United Nations, 2003)
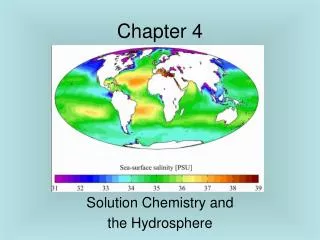
Water Availability • Water covers about 72% of the Earth, however only 2.5% of that considered freshwater.
What is Water Pollution? Water pollution is… Any chemical, biological, or physical change in water quality that has a harmful effect on living organisms or makes water unsuitable for desired usage.
Water Pollution & Agriculture • Agriculture is the single largest user of freshwater resources, using a global average of 70% of all surface water supplies. • Industrial agriculture is one of the leading causes of water pollution in the United States. • Agricultural activity was identified as a source of pollution for 48% of stream or river water and 41% of lake water. (EPA: National Water Quality Inventory, 2000)
Surface Water Surface water is water collecting on the ground or in a stream, river, lake, wetland, or ocean. • Naturally replenished by precipitation, lost through evaporation into the atmosphere, and seeps into groundwater
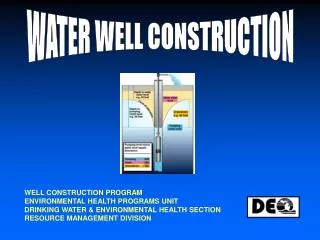
Groundwater Groundwater is water located beneath the earth's surface in soil pore spaces and in the fractures of rock formations. • Aquifers are defined as water-bearing porous soil or rock strata that yield significant amounts of water to wells.
Groundwater Solutions Prevention is easier and less expensive than cleanup.
Water Pollution Point Source Pollution • comes from a specific source, like a pipe • factories, industry, municipal treatment plants • can be monitored and controlled by a permit system Nonpoint Source Pollution • Nonpoint Source (NPS) Pollution is pollution associated with stormwater or runoff • NPS pollution cannot be traced to a direct discharge point such as a wastewater treatment facility
Point vs. Nonpoint NONPOINT SOURCES Rural homes Cropland Urban streets Animal feedlot POINT SOURCES Suburban development Factory Wastewater treatment plant
Nonpoint Water Pollution Often due to impermeable surfaces • Runoff is increased when impervious surfaces are increased Examples include • sewage & cleaners from boats • household cleaning products • litter & garbage • oil & grease from cars • fertilizers • animal waste • grass clippings • septic systems
Pollutants Found in Runoff • Sediment Soil particles transported from their source • Biochemical Oxygen Demand (BOD) ● Oxygen depleting material • Leaves • Organic material • Debris Litter and illegal dumping • Toxics ● Pesticides • Herbicides • Fungicides • Insecticides ● Metals (naturally occurring in soil, automotive emissions/ tires) • Lead • Zinc • Mercury ● Petroleum Hydrocarbons (automotive exhaust and fuel/oil) • Nutrients ● Various types of materials that become dissolved and suspended in water (commonly found in fertilizer and plant material): • Nitrogen (N) • Phosphorus (P) Bacteria/ Pathogens Originating from: ● Pets ● Waterfowl ● Failing septic systems • Thermal Stress Heated runoff, removal of streamside vegetation
5 Types of Water Pollution • Sediment reduces light penetration in stream, clogs gills of fish and aquatic invertebrates. • Nutrientsact as fertilizer for algae & aquatic plants which can cause low dissolved oxygen levels = eutrophication. At low DO levels, the aquatic life has the potential to be harmed. • Trash and Organic Debris Leaves, grass clippings, garbage, and animal waste become part of the runoff entering storm drains. • Chemicals can impact life and contaminate drinking water supplies. • Bacteria/Pathogens are an indicator of possible viruses present in the system.
Water Pollution Impacts • fish and wildlife • recreational water activities • commercial fishing • tourism • drinking water quality • human health • harms crops
Sediment • When large quantities of soil enter waterways, pollution occurs. • In terms of sheer volume, sediment is one of the most devastating pollutants affecting waterways. • Sediment pollution reduces streams and reservoirs volume capacity and increases the expense to treat water. Millions of dollars are spent each year to remove excess sediment. • Sediment suspended in water destroys fish and wildlife habitat. Sediment from eroding stream banks and land surfaces and agricultural and industrial chemicals carried by that sediment could smother aquatic life, clog fish gills, and off light to underwater plants. • Sediment pollution can be just as deadly to aquatic life as chemicals
Nutrients • Nutrients are essential to water life, but too much can harm more than help. Phosphorous, nitrogen, and potassium are nutrients that help plants and animals grow. Found in fertilizer, sewage, detergents, and animal wastes • Excess nutrients in an already healthy environment can be dangerous. • Too many nutrients can cause an overgrowth of vegetation or bloom of algae. Eventually the algae dies and decays. The decaying process depletes oxygen in the water, leaving less for aquatic plants and animals. The balance of life in the stream ecosystem is interrupted and disturbed. • An overgrowth of algae also minimizes the amount of light that can reach aquatic plants. An increase in dead organic material from the dying plants exacerbates the problems associated with low oxygen levels.
Eutrophication of Lakes Eutrophication: nutrient enrichment of lakes mostly from runoff of plant nutrients (nitrates & phosphates) • During hot dry weather can lead to algae blooms • Decrease of photosynthesis • Dying algae then drops DO levels • Fish kills, bad odor
Trash and Organic Debris • Leaves, grass clippings, garbage, and animal waste become part of the runoff entering storm drains and local waterways and clogging the system. Decaying organic matter like leaves contributes to eutrophication. • Trash and organic debris is one of the easiest types of NPS pollution to control. • Dispose of litter in garbage cans or in recycling bins. Recycle glass, aluminum, plastic, paper, motor oil, and newspapers. Compost yard and garden waste. Pick up pet waste and bag it with regular household trash or flush it in the toilet. • And, never intentionally dump anything into a storm drain.
Chemicals & Heavy Metals • Includes organic chemicals, pesticides, herbicides, formaldehyde, household chemicals, paint, paint cleaners, gasoline, motor oil, battery acid, DDT, PCBs, Medicines, etc. • Heavy Metals • Mercury • Cadmium • Lead • Copper • Arsenic
Biomagnification of Toxins Diagram showing biomagnifications of PCBs in an aquatic food chain from the Great Lakes. Increased PCB concentration as toxins move up the food chain.
Pathogens • Most serious water pollutants in terms of human health worldwide are pathogenic organisms. • Main source of these pathogens is from untreated or improperly treated human wastes. • In developed countries, sewage treatment plants and other pollution-control techniques have reduced or eliminated most of the worst sources of pathogens • The situation is quite different in less-developed countries. The United Nations estimates that at least 2.5 billion people in these countries lack adequate sanitation, and that about half these people also lack access to clean drinking water.
Case Study: The Great Lakes • Pollution levels dropped, but long way to go • 95% of U.S. freshwater • 30% Canadian pop, 14% U.S. • 38 million drink • 1% flow out St. Lawrence • Toxic fish
Case Study: The Gulf of Mexico • Caused by drainage from the Mississippi River • Area varies in size, but can cover up to 6,000-7,000 sq. miles • Low oxygen can not support life • Devastating to local fisheries
How do you determine if a body of water is healthy or polluted?
Water Quality Index (WQI) A WQI provides a single number (like a grade) that expresses overall water quality at a specific location and time based on several water quality parameters. Measures how healthy a body of water is.
Water Quality Tests • Dissolved Oxygen = required to support plants and animals • pH = acidic (H+) or basic (OH-) • Temperature = too warm or cool is damaging • Total Phosphate = essential plant nutrient • Nitrates/Ammonia = causes growth, decay, and eutrophication • Turbidity = water clarity, light penetration • Fecal Coliform= feces, bacteria, pathogens • Bioindicators = living organisms that relate to water quality
Dissolved Oxygen (DO) • Amount of gaseous oxygen (O2) dissolved in water • Oxygen gets into water by diffusion from the surrounding air, by aeration, and through photosynthesis • DO range from 0-18 mg/L • Need 5-6 mg/L to support a diverse population • DO < 2 mg/L - Hypoxia
pH Measures hydrogen ion concentration (H+) Measured on a logarithmic scale from 0-14 • 7 is neutral and ideal for many organisms (H2O) • High pH up to 14 = alkaline (OH-) • Low pH down to 0 = acidic (H+)
Temperature Thermal pollution • Many power plants use water as a coolant and discharge the water at a higher temperature. • Thermal shock can kill aquatic life. Cool water holds more oxygen than warm water. • Ice can hold oxygen for a long period of time (ice core samples) Landsat image of Lake Trawsfyndd, Wales illustrating color differentiation of temperature differences induced by power plant thermal pollution. Source: NASA
Phosphates Phosphates act as a fertilizer for aquatic plants but can create algal blooms when quantities are too high. • Sources of phosphorus include human and animal wastes (sewage), industrial wastes, soil erosion, and fertilizers. • Phosphate concentrations have been restricted in manufacturing to prevent water quality problems. • Phosphate levels higher than 0.03 ppm contribute to increased plant growth.
Nitrates Nitrates (NO3) are formed when bacteria combine the ammonia from animal waste or decay with oxygen. • Excess nitrogen causes algal blooms and eutrophication • Measured in PPMs
Turbidity • Turbidity = the amount of cloudiness in the water • Caused by suspended matter like silt, sand mud, bacteria, chemical precipitates • Can be measured with a Secchi Disk or turbidity tube
Macroinvertebrates Animals that have no backbone and are visible without magnification Bioindicators • Organisms that provide information about the health of an ecosystem. • High quality species = healthy environment • Pollution tolerant species: may indicate poor water quality
Water Regulations • The Clean Water Act (CWA) was enacted in 1948 to ensure all water was kept pollutant free. It was amended in 1972 to regulate discharges of pollutants into the U.S. waters and control quality standards for surface waters. • The Safe Drinking Water Act (SDWA) was established in 1974 to ensure that all U.S citizens had access to safe drinking water. • The U.S. Environmental Protection Agency (EPA) monitors water in the United States.
Areas of Progress • The 1972 Clean Water Act established a National Pollution Discharge Elimination System (NPDES), which requires an easily revoked permit for any industry, municipality or other entity dumping wastes in surface waters. • Since the Clean Water Act was passed, much of the effort has been aimed at point sources, especially to build or upgrade thousands of municipal sewage treatment plants. As a result, nearly everyone in urban areas is now served by municipal sewage systems and no major city discharges raw sewage into a river or lake except as overflow during rainstorms.
Remaining Issues in Water • Nonpoint discharges of pollutants are the greatest impediments to achieving national goals of water quality. • About 75% of the water pollution in the United States comes from soil erosion, fallout of air pollutants, and surface runoff from urban areas, farm fields, and feedlots. • Nitrates and phosphates in surface water have decreased from point sources but have increased about four-fold since 1972 from nonpoint sources. • Fossil fuel combustion has become a major source of nitrates, sulfates, arsenic, cadmium, mercury, and other toxic pollutants.
Water Pollution Solutions • Establish and enforce laws and regulations • Low-impact agricultural practices • Improved sewage treatment systems • Proper disposal and use of chemicals • Use of mitigated wetlands • Reduce runoff • Buffer strips, bioswales, permeable paving, increase vegetation and decrease slopes • Use natural alternatives to chemicals • Personal accountability