Download
1 / 41
550 likes | 1.1k Views
Chapter 26: International Trade and Capital Flows. Learning Objectives. Understand how trade balances and net capital flows are related Show how international trade affects a country's consumption possibilities Explain who wins and who loses with free trade

E N D
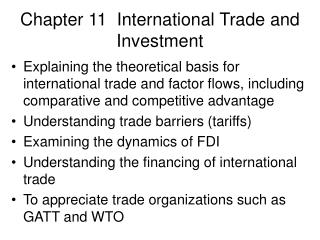
Learning Objectives • Understand how trade balances and net capital flows are related • Show how international trade affects a country's consumption possibilities • Explain who wins and who loses with free trade • Describe the effects of tariffs and quotas on domestic prices, production, and consumption • Analyze the factors that determine international capital flows and how these flows affect domestic savings and interest rates • Use the relationship between domestic saving and the trade balance to understand how domestic saving, the trade balance, and net capital inflows are related
International Trade • National economies do not exist in isolation but are increasingly interdependent • Trade is important even to a large economies. However, international flows of goods and services become sometimes a matter of political and economic concern • Trade and capital flows are easily politicized • Free trade can be seen to cost local jobs • U.S.-Morocco Free Trade Agreement • Foreign control of "essential" assets such as ports or telecommunications infrastructure • Dubai Ports World
The Trade Balance and Net Capital Inflows • Trade balance is another name for net exports (NX) • Value of a country's exports minus the value of its imports • A trade surplus is a positive trade balance • Exports > imports • A trade deficit is a negative trade balance • Imports > exports
Capital Flows • International capital flows are transactions of real estate and financial assets across international borders • Capital inflows are purchases of domestic assets by foreign households and firms • Capital outflows are purchases of foreign assets by domestic households and firms • Net capital inflows (KI) are capital inflows minus capital outflows • Capital flows are not counted as imports or exports since the funds are used to purchase assets • Imports and exports are goods and services produced in the current year
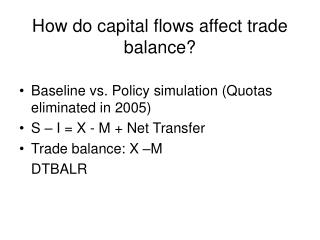
Trade Balance (NX) and Net Capital Inflows (KI) NX + KI = 0 • UAE resident purchases Japanese car for $20,000 • Imports = $20,000 • Manufacturer holds $20,000 in a UAE bank account • Option 1: purchase $20,000 of UAE goods and services so exports = $20,000 • Option 2: purchase UAE bonds or UAE real estate • NX = – $20,000, KI = $20,000 • Option 3: sell dollars for yen • Follow the dollars and see what the purchaser does with them to determine NX and KI
The Principle of Comparative Advantage The Principle of Comparative AdvantageEveryone does best when each concentrates on the activity with the lowest opportunity cost
Comparative Advantage • Comparative advantageis determined by factors such as • Climate ■ Human capital • Natural resources ■ Financial systems • Technology ■ Culture • A closed economy is an economy that does not trade with the rest of the world • An open economy is an economy that trades with other countries
Production Possibilities Curve A • Economy with two goods • If 1,000 computers are produced, the maximum amount of coffee is 100,000 pound • Moving from C to D, the economy • Gives up 60,000 kg of coffee • Gains 1,000 computers per year • Curvature results from the Principle of Increasing Opportunity Cost C 100,000 Coffee (kg/year) D 40,000 B 1,000 2,000 Computers (number/year)
Production and Consumption Possibilities • Production possibilities curve shows the quantities of different goods that an economy can produce • Consumption possibilities curve shows the quantities of different goods that a country could consume • Production and consumption possibilities are the same if a country does not trade • Autarky is a situation where a country does not trade • In an open economy, a society's consumption possibilities are greater than its production possibilities
Buying and Selling in World Markets Egypt Starts at D E • Egypt begins at point D, 2,000 computers and 50,000 kg of coffee • World prices are $10/kg of coffee and $500/computer • Sell 2,000 computers for $1 million and buy 100,000 kg of coffee • Moves the economy to E, beyond its PPC • Sell 50,000 kg of coffee for $0.5 million and buy 1,000 computers • Moves the economy to F 150 Trade options A 120 C 100 PPC Coffee (000s kg/year) D 50 Z F B 1 2 2.4 3 Computers( 000s/year)
Buying and Selling in World Markets Egypt Starts at D E • Operating at D is not Egypt's best choice • Trade options between C and D are inefficient • Egypt could have more coffee and more computers than X without trade • Egypt is in the best position if it chooses a point where the trade options are entirely on or outside the PPC 150 Trade options A 120 C 100 PPC Coffee (000s kg/year) X D 50 Z F B 1 2 2.4 3 Computers( 000s/year)
Optimal Production Mix for an Open Economy Egypt Works at G • The trade options line, LM, is tangent to the production possibilities frontier at G • G is the optimal production level • Slope of LM is determined by prices: 160,000 coffee / 3,200 computers = 50 kg of coffee / computer • By producing at G, Egypt can consume at any point on LM • LM is the consumption possibilities curve L 160 150 CPC E 120 A 100 C G Coffee (000s kg/year) 50 PPC D M B F 1 2 2.4 3 3.2 Computers (000s/year)
Optimal Production Mix for an Open Economy Egypt Works at G At G • The opportunity cost of producing one more computer EQUALS • The opportunity cost of purchasing one more computer AND • The opportunity cost of producing one more pound of coffee EQUALS • The opportunity cost of purchasing an extra pound of coffee L 160 CPC G Coffee (000s kg/year) PPC M F 3.2 Computers (000s/year)
A Simple Economy • Islandia produces coffee and tea • 100 workers are equally productive in both products • One work-day produces 8 kg of coffee or tea • Islandia's goal is to produce the highest value of total output • Value depends on world prices • Produce the good with the highest price • Sell some • Buy the other, lower-priced good
A Simple Economy • Islandia's production possibilities curve is a straight line • If only coffee is produced, output is 800 kg per day • If only tea is produced, output is 800 kg per day • Any combination between these is possible Islandia Production Possibilities Curve A 800 Coffee (kg/year) B 600 C 200 D 200 600 800 Tea (kg/year)
Two Consumption Possibilities Curves Price of Tea Twice Price of Coffee Produce at A Price of Coffee Twice Price of Tea Produce at D A A' 1,600 800 600 B A 800 CPC Coffee (kg/year) Coffee (kg/year) B 600 C CPC 200 PPC 200 PPC C D' D D 1,600 200 600 800 200 600 800 Tea (kg/year) Tea (kg/year)
Production and Consumption Possibilities • If the price of coffee and tea are the same, there are no gains from trade for Islandia • Produce what you want and consume it • Suppose the production possibilities curve is convex • Produce where the opportunity cost of production equals the opportunity cost in trade • Pick a point on the consumption possibilities curve • Trade to reach that point
Trade for Egypt • World prices are $10 per kg of coffee and $500 per computer (shown by LM) • Egypt produces at G • 80,000 kg of coffee • 1,600 computers • Consumption is at N • Export 20,000 kg of coffee for $200,000 • Import 400 computers for $200,000 • N is outside the production possibilities curve Egypt Works at G L 160 CPC 120 100 C G 80 Coffee (000s kg/year) N 60 PPC M 1.6 3.2 1 2 Computers (000s/year)
Benefits of Free Trade • Free trade produces net benefits • Some gain; some lose • Free trade is efficient • Increases total economic surplus in the economy • Equilibrium Principle
Protectionism and Tariffs • Protectionism is the view that free trade is injurious and should be restricted • Tariff is a tax imposed on an imported good • Egypt imposes a tariff on imported computers • Same as an increase in the world price of computers • Domestic price increases to world price plus tariff • Consumers pay more for computers than with free trade and business profits increase • Quantity demanded decreases and quantity supplied increases • Imports decrease and government revenues go up
Honda Civic in Egypt versus the UAE • Egyptian residents pay more than $30,000 for a 1.6-liter Civic. • UAE residents pay about $20,000 for a 1.8-liter Civic. • Egypt imposes a 40 percent tariff and 15 percent value-added tax on all imported cars not exceeding 1.6 liters. • The UAE imposes a flat 5 percent tax on all imported goods exceeding a value of $300.
Protectionism and Quotas • Quota is a legal limit on the quantity or value of a good that may be imported • Usually administered by permits issued to importers • Economic effects are similar to a tariff • Domestic price increases to the benefit of domestic producers • Domestic consumers pay higher prices • Foreign manufacturers sell fewer units • The key difference between tariffs and quotas is the gains captured by permit holders • Buy at world prices and sell at a higher price
Voluntary Export Restrictions (VER) • Higher gas prices of the 1970s caused consumers' preferences for fuel-efficient Japanese cars to increase • Demand for US cars decreased • In 1981, US negotiated an agreement with Japan to limit their exports to the US voluntarily • System lasted until 1994 • US and European car manufacturers benefited from lower competition • Japanese companies benefited from higher prices for their products • Consumers paid higher prices for cars • Cost of VERs estimated at $3 billion per year
Other Trade Barriers • There are bureaucratic ways to decrease imports • Strict application of rules for health and safety • Refusal to accept drug trial results conducted outside the US, for example • Testing and certification procedures for compliance to a technology standard • Bans on genetically modified foods in Europe • Use of the Imperial system instead of metric system increases the cost of doing business in the US • Different electricity characteristics have same effect
The Inefficiency Of Protectionism • Free trade is efficient; protectionism reduces total surplus • Protectionism confers benefits on favored groups • If trade barriers are removed, total surplus increases • Divert some of the increase to compensate those hurt by trade • Reduces resistance to free trade in those who bear the costs • Environmental concerns are better addressed under a free trade system • Restrictions impose costs on poor countries (polluters), reducing the resources for clean-up
International Capital Flows • Highly developed financial markets allow borrowing and lending across borders • Transactions are subject to laws in the originating country and the target country • Size of international flows for a country depend on its regulations and laws • Also depend on economic integration and political stability • Lending is acquiring a real of financial asset • Buying a share of stock or a government bond or a parcel of land • Borrowing is selling a real or financial asset
International Capital Flows • Capital inflows to the home country include foreign purchases of • Stocks and bonds of local companies • Local government bonds • Real assets such as land and buildings owned by local residents • Capital flows respond to real interest rates • Higher domestic interest rates mean greater capital inflows KI < 0Net capitaloutflows KI Domestic Real Interest Rate (r) KI > 0Net capitalinflows 0 Net Capital Inflows (KI)
Risk and Capital Inflows • For a given real interest rate, increase in riskiness in of domestic assets decreases capital inflows • Shifts the capital inflow curve to the left • Foreigners are less willing to buy domestic assets • Domestic savers are more willing to buy foreign assets KI' KI Domestic Real Interest Rate (r) 0 Net Capital Inflows (KI)
Savings, Investment, Capital Inflows • Definition of output Y = C + I + G + NX • Solve for I Y – C – G – NX = I • National savings, S, is (Y – C – G) S – NX = I • Also NX + KI = 0 OR KI = – NX • So S + KI = I
S + KI = I S + KI • Savings plus net capital inflows equals investment in new capital goods • Foreign savings can supplement domestic savings to create capital goods to support economic growth • In a closed economy,S = I • In an open economy,S + KI = I • Capital inflows mean more investment and lower interest rates Real interest rate (%) r* I S, I Saving and investment
Capital Flows and Debt Crises • Developing countries fund their growth with capital inflows • Incomes are too low for large domestic savings • High rates of return on infrastructure and early investments • Interest on foreign loans and eventually, the principle, must be paid • If investments are not productive, there are insufficient funds to pay interest and repay the loan: a debt crisis
Argentina, 2001 - 2002 • Argentina has natural resources and human capital • Good potential for economic growth • Low national savings rate • Large capital inflows • Invest more and grow quickly • Large debt to foreigners • Foreigners loaned willingly provided there was a good return
Argentina, 2001 – 2002 • 1995 – 1997 was a high growth period • The Argentine economy slowed in 1998 • Tax receipts decreased and demand for government services increased • Government at all levels ran large deficits • The need for foreign funds grew rapidly • Perceived risk increased and capital inflows slowed • Interest rates increased, domestic investment decreased and the economy continued to weaken • Argentina was eventually forced into default • Worked with IMF and others to restart the economy
The Savings Rate and the Trade Deficit • Trade deficits result from low domestic savings S – I = NX • Holding investment constant, a high rate of savings results in high net exports • If S < I, the country is a net importer and NX < 0 • Suppose a country has a low national savings rate • G and C are large relative to Y • Strong demand for imports • Few goods available for export • The country will have a trade deficit
The Savings Rate and the Trade Deficit • If national savings rate is low, the savings will not be sufficient to finance domestic investment • Many good investments available for foreign funds • Capital flows in • Low levels of savings increases interest rates and attracts foreign capital inflows