Download
1 / 23
230 likes | 389 Views
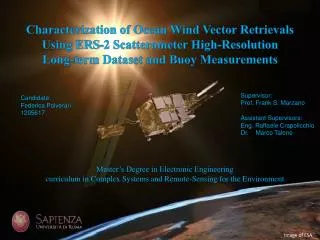
Characterization of Ocean Wind Vector Retrievals Using ERS-2 Scatterometer High-Resolution Long-term Dataset and Buoy Measurements. Supervisor: Prof. Frank S. Marzano. Candidate: Federica Polverari 1205617. Assistant Supervisors : Eng . Raffaele Crapolicchio Dr. Marco Talone.

E N D
Characterization of Ocean Wind Vector Retrievals Using ERS-2 Scatterometer High-Resolution Long-term Dataset and Buoy Measurements Supervisor: Prof. Frank S. Marzano Candidate: Federica Polverari 1205617 AssistantSupervisors: Eng. Raffaele Crapolicchio Dr. Marco Talone Master’s Degree in Electronic Engineering curriculum in Complex Systems and Remote-Sensing for the Environment Image of ESA
Outline • The ERS-2 Scatterometer • Data • Data Selection • Methodology • L1 Validation • L2 Validation • Main Results • L1 • L2 • Conclusions
ERS-2 Scatterometer The European Remote-sensing Satellite (ERS)-2 was involved in Earth Observation activities and it was launched in 1995 as follow-on of the ERS-1 mission ERS-2 embarks an Active Microwaves Instrument (AMI) in which it is incorporated a radar instrument called Scatterometerworking at 5.3 GHz The scatterometer is designed to measure the Normalized Radar Cross Section (NRCS) of the sea surface R: distance target-radar Wr: received power Wt :transmitted power F: scatterometer foootprint Lampda: radar wavelenght D: Directivity gain The NRCS is obtained by the scattering mechanism (Bragg Scattering) of wind-generated capillary waves which are in equilibrium with the near-surface wind over the ocean Image from ESA Website Image from Stoffelen, 2008 Thanks to the Geophysical Model Function and Inversion Algorithms, from NRCS measurements it is possible to estimate the WIND SPEED and WIND DIRECTION at 10 m above the mean sea level
Data The European Remote sensing Satellite (ERS)-2 Wind Speed (WS) and Direction (WD) This database covers the period during 1997-2003 The products available for the users are the Advanced Scatterometer Processing System (ASPS ) Level 2.0 products The investigation has been carried out using the High Resolution (25 km) products The In-Situ Wind Speed and Direction provided by the Prediction and Research Moored Array in the Atlantic (PIRATA) Image from PIRATA Website
Data Selection The spatial and temporal collocation is the way to find satellite and buoy data pairs which can be compared. Spatial Collocation: Temporal Collocation: Nodes whose distance from a buoy position is less than 1 degree (~100km) are selected From the spatial collecated data, nodes whose time difference from buoy acquisition time is less than 10 min are selected One buoy measurement several satellite measurements
Data Selection Repetition of buoy WS and WD for each scatterometer measurement • Average of scatterometer WS and WD • Weighted average on square distance One buoy measurement several satellite measurements
Methodology – L1 Validation at Level1: comparison between predicted and estimated coefficients of the C-band Geophisical Model Function (GMF) for equivalent neutral wind CMOD5.N remotely sensed in situ WS,WD Repetition WS*,WD* CMOD5.N σ° σ°* Fitting Fitting A0, A1, A2 A0*, A1*, A2*
Main Results – L1 4 m/s (blue), 8 m/s (red),12 m/s (black) • The estimated (dots) and predicted (full line) • A0 exhibit a similar behaviour for each beam
MainResults-L1:ForeBeam Additional analysis: Spatial collocation 50 km Benefit: reduction of the Representativity Error Number of samples is strongly reduced 821021 188670 Spatial collocation: 50 km Spatial collocation: 100 km Threshold: 80 measurements
Main Results-L1:Mid Beam Spatial collocation: 50 km Spatial collocation: 100 km
Main Results-L1: Aft Beam Spatial collocation: 50 km Spatial collocation: 100 km
Methodology – L2 Comparison and statistical analysis between buoys and scatterometer in term of wind speed and wind direction • The case of buoy 10S 10W (out of 13): with the greatest number of matches In ordertohavecollocatedmeasurementscouples, wehaveconsidered the followingcriteria : Meanof satellite WS and WD relatedtoeachbouymeasurements Weightedaverage on squaredistance
Main Results – L2 Comparison and statistical analysis between buoys and scatterometer in term of wind speed and wind direction • The case of buoy 10S 10W (out of 13): with the greatest number of matches Wind Speed Misfit (considering the mean) Normalized Histogram σ = 1.5
Main Results – L2 Seasonal Trend of Wind Speed Seasonal Trend of Wind Direction
Main Results-L2 Combining the collocated measurements from all the available buoys • Wind Speed Misfit indeces: • 0 - 0.2 m/s • 0.2 - 0.5 m/s • 0.5 - 1 m/s • > 1m/s • Wind Direction Misfit indeces: • 0° - 3° • 3° - 10° • 10° - 30° • > 30°
Main Results-L2 Combining the collocated measurements from all the available buoys To characterize the three wind speed ranges: Buoys and ERS-2 wind speed difference against buoy wind speed WS < 4 m/s: negative differences thus the satellite tends to overestimate the lower wind. WS > 9 m/s: positive differences thus the satellite tends to underestimate higher wind 4 m/s < WS < 9 m/s greatest concentration of measurements whose differences are around 0 m/s
Main Results-L2 Characterization of the misfit in term of buoy wind speed Characterization of the misfit in term of ERS-2 wind speed
Conclusions From this first analysis of the ERS-2 and PIRATA buoys datasets during the period between 1997-2003, with the chosen criteria we can conclude that: • From the validation at Level 1 • The validity of the ERS-2 GMF has been checked: • the buoy wind measurements are able to retrieve the characteristics of ERS-2 backscatter coefficient measurements with main discrepancies for higher winds; • Not significant changes can be observed with the reduction of the spatial collocation. • From the validation at Level 2 • The ERS-2 measurements are consistent with the buoys wind measurements : • the Wind Speed difference is less than 1 m/s on average; • the Wind Direction difference is less than 30 degree on average; • ERS-2 overestimates lower winds and underestimates higher winds. Reference: A., Bentamy, D. Croize-Fillon, C., Perigaud, “Characterization of ASCAT measurements based on buoy and QuikSCAT wind vector observations”, Ocean Sci., 4, 265-274, 2008.
Acknoledgements Thanks to: Prof. Frank S. Marzano Raffaele Crapolicchio Marco Talone All colleagues of Serco SpA Thankyouforyourattention!
Focusing On • CMOD5.N: similar to a second order Fourier expression, the power 1.6 was included because it avoids the need of higher harmonics. 2) Neutral Wind: is the wind at 10-metre heigh for given surface stress that would be observed if there was neutral atmospheric stratification [Geernaert and Katsaros 1986].
Main Results – L2 Statistics for each buoy