Download

1 / 57
570 likes | 594 Views
Explore the factors that influence interest rates on bonds, including default risk, liquidity, and tax considerations. Learn about the theories explaining the term structure of interest rates.

E N D
ME_3 The Risk and Term Structure of Interest Rates
Figure 1 Long-Term Bond Yields, 1919–2014 Sources: Board of Governors of the Federal Reserve System, Banking and Monetary Statistics, 1941–1970; Federal Reserve Bank of St. Louis FRED database: http://research.stlouisfed.org/fred2
Learning Objectives • Identify and explain three factors explaining the risk structure of interest rates. • List and explain the three theories of why interest rates vary across maturities.
Risk Structure of Interest Rates • Bonds with the same maturity have different interest rates due to: • Default risk • Liquidity • Tax considerations
Risk Structure of Interest Rates • Default risk: probability that the issuer of the bond is unable or unwilling to make interest payments or pay off the face value • U.S. Treasury bonds are considered default free (government can raise taxes). • Risk premium: the spread between the interest rates on bonds with default risk and the interest rates on (same maturity) Treasury bonds
Figure 2 Response to an Increase in Default Risk on Corporate Bonds Price of Bonds, P Price of Bonds, P Sc Risk Premium Quantity of Corporate Bonds Quantity of Treasury Bonds (b) Default-free (U.S. Treasury) bond market (a) Corporate bond market Step 1. An increase in default risk shifts the demand curve for corporate bonds left . . . Step 2. and shifts the demand curve for Treasury bonds to the right . . . Step 3. which raises the price of Treasury bonds and lowers the price of corporate bonds, and therefore lowers the interest rate on Treasury bonds and raises the rate on corporate bonds, thereby increasing the spread between the interest rates on corporate versus Treasury bonds.
Table 1 Bond Ratings by Moody’s, Standard and Poor’s, and Fitch
Risk Structure of Interest Rates • Liquidity: the relative ease with which an asset can be converted into cash • Cost of selling a bond • Number of buyers/sellers in a bond market • Income tax considerations • Interest payments on municipal bonds are exempt from federal income taxes.
Figure 3 Interest Rates on Municipal and Treasury Bonds Price of Bonds, P Price of Bonds, P ST Sm Quantity of Municipal Bonds Quantity of Treasury Bonds (b) Market for Treasury bonds (a) Market for municipal bonds Step 1.Tax-free status shifts the demand for municipal bonds to the right . . . Step 2.and shifts the demand for Treasury bonds to the left . . . Step 3.with the result that municipal bonds end up with a higher price and a lower interest rate than on Treasury bonds.
Figure 4 Movements over Time of Interest Rates on U.S. Government Bonds with Different Maturities Sources: Federal Reserve Bank of St. Louis FRED database: http://research.stlouisfed.org/fred2/
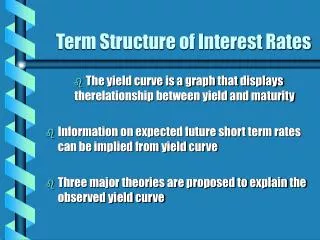
Term Structure of Interest Rates • Bonds with identical risk, liquidity, and tax characteristics may have different interest rates because the time remaining to maturity is different
Term Structure of Interest Rates • Yield curve: a plot of the yield on bonds with differing terms to maturity but the same risk, liquidity and tax considerations • Upward-sloping: long-term rates are above short-term rates • Flat: short- and long-term rates are the same • Inverted: long-term rates are below short-term rates
Term Structure of Interest Rates The theory of the term structure of interest rates must explain the following facts: • Interest rates on bonds of different maturities move together over time. • When short-term interest rates are low, yield curves are more likely to have an upward slope; when short-term rates are high, yield curves are more likely to slope downward and be inverted. • Yield curves almost always slope upward.
Three theories to explain the three facts: (The first: ) • Expectations theory explains the first two facts but not the third. • Segmented markets theory explains the third fact but not the first two. • Liquidity premium theory combines the two theories to explain all three facts.
Expectations Theory • The interest rate on a long-term bond will equal an average of the short-term interest rates that people expect to occur over the life of the long-term bond. • Buyers of bonds do not prefer bonds of one maturity over another; they will not hold any quantity of a bond if its expected return is less than that of another bond with a different maturity. • Bond holders consider bonds with different maturities to be perfect substitutes.
Computing the Price of Common Stock The One-Period Valuation Model:
Computing the Price of Common Stock The Generalized Dividend Valuation Model:
Computing the Price of Common Stock The Gordon Growth Model:
How the Market Sets Stock Prices • The price is set by the buyer willing to pay the highest price. • The market price will be set by the buyer who can take best advantage of the asset. • Superior information about an asset can increase its value by reducing its perceived risk.
How the Market Sets Stock Prices • Information is important for individuals to value each asset. • When new information is released about a firm, expectations and prices change. • Market participants constantly receive information and revise their expectations, so stock prices change frequently.
Application: The Global Financial Crisis and the Stock Market • The financial crisis that started in August 2007 led to one of the worst bear markets in 50 years. • Downward revision of growth prospects: ↓g • Increased uncertainty: ↑ke • Gordon model predicts a drop in stock prices.
The Theory of Rational Expectations • Adaptive expectations: • Expectations are formed from past experience only. • Changes in expectations will occur slowly over time as data changes. • However, people use more than just past data to form their expectations and sometimes change their expectations quickly.
The Theory of Rational Expectations • Expectations will be identical to optimal forecasts using all available information. • Even though a rational expectation equals the optimal forecast using all available information, a prediction based on it may not always be perfectly accurate. • It takes too much effort to make their expectation the best guess possible. • The best guess will not be accurate because the predictor is unaware of some relevant information.
Rationale Behind the Theory • The incentives for equating expectations with optimal forecasts are especially strong in financial markets. In these markets, people with better forecasts of the future get rich. • The application of the theory of rational expectations to financial markets (where it is called the efficient market hypothesis or the theory of efficient capital markets) is thus particularly useful.
Implications of the Theory • If there is a change in the way a variable moves, the way in which expectations of the variable are formed will change as well. • Changes in the conduct of monetary policy (e.g. target the federal funds rate) • The forecast errors of expectations will, on average, be zero and cannot be predicted ahead of time.
The Efficient Market Hypothesis: Rational Expectations in Financial Markets
The Efficient Market Hypothesis: Rational Expectations in Financial Markets At the beginning of the period, we know Pt and C. Pt+1 is unknown and we must form an expectation of it. The expected return then is Expectations of future prices are equal to optimal forecasts using all currently available information so Supply and Demand analysis states Rewill equal the equilibrium return R*, so Rof = R*
The Efficient Market Hypothesis: Rational Expectations in Financial Markets • Current prices in a financial market will be set so that the optimal forecast of a security’s return using all available information equals the security’s equilibrium return. • In an efficient market, a security’s price fully reflects all available information.
Expectations Theory • Expectations theory explains: • Why the term structure of interest rates changes at different times. • Why interest rates on bonds with different maturities move together over time (fact 1). • Why yield curves tend to slope up when short-term rates are low and slope down when short-term rates are high (fact 2). • Cannot explain why yield curves usually slope upward (fact 3)
Three theories to explain the three facts: (TWO ) • Expectations theory explains the first two facts but not the third. • Segmented markets theory explains the third fact but not the first two. • Liquidity premium theory combines the two theories to explain all three facts.
Segmented Markets Theory • Bonds of different maturities are not substitutes at all. • The interest rate for each bond with a different maturity is determined by the demand for and supply of that bond. • Investors have preferences for bonds of one maturity over another. • If investors generally prefer bonds with shorter maturities that have less interest-rate risk, then this explains why yield curves usually slope upward (fact 3).
Three theories to explain the three facts: (Three) • Expectations theory explains the first two facts but not the third. • Segmented markets theory explains the third fact but not the first two. • Liquidity premium theory combines the two theories to explain all three facts.
Liquidity Premium & Preferred Habitat Theories • The interest rate on a long-term bond will equal an average of short-term interest rates expected to occur over the life of the long-term bond plus a liquidity premium that responds to supply and demand conditions for that bond. • Bonds of different maturities are partial (not perfect) substitutes.
Preferred Habitat Theory • Investors have a preference for bonds of one maturity over another. • They will be willing to buy bonds of different maturities only if they earn a somewhat higher expected return. • Investors are likely to prefer short-term bonds over longer-term bonds.
Figure 5 The Relationship Between the Liquidity Premium (Preferred Habitat) and Expectations Theory Liquidity Premium (Preferred Habitat) Theory Yield Curve Interest Rate, int Liquidity Premium, lnt 0 5 10 15 20 25 30 Years to Maturity, n Expectations Theory Yield Curve
Liquidity Premium & Preferred Habitat Theories • Interest rates on different maturity bonds move together over time; explained by the first term in the equation • Yield curves tend to slope upward when short-term rates are low and to be inverted when short-term rates are high; explained by the liquidity premium term in the first case and by a low expected average in the second case • Yield curves typically slope upward; explained by a larger liquidity premium as the term to maturity lengthens
Figure 6 Yield Curves and the Market’s Expectations of Future Short-Term Interest Rates According to the Liquidity Premium (Preferred Habitat) Theory Yield to Maturity Yield to Maturity Steeply upward-sloping yield curve Mildly upward-sloping yield curve Term to Maturity Term to Maturity (a) (b) Yield to Maturity Yield to Maturity Downward-sloping yield curve Flat yield curve Term to Maturity Term to Maturity (c) (d)
ME_A00 Intermediaries & transaction cost
Learning Objectives • Identify eight basic facts about the global financial system. • Summarize how transaction costs affect financial intermediaries. • Describe why asymmetric information leads to adverse selection and moral hazard. • Recognize adverse selection and summarize the ways in which they can be reduced.
Learning Objectives • Recognize the principal-agent problem arising from moral hazard in equity contracts and summarize the methods for reducing it. • Summarize the methods used to reduce moral hazard in debt contracts
Basic Facts about Financial Structure Throughout the World • This chapter provides an economic analysis of how our financial structure is designed to promote economic efficiency. • The bar chart in Figure 1 shows how American businesses financed their activities using external funds (those obtained from outside the business itself) in the period 1970–2000 and compares U.S. data to those of Germany, Japan, and Canada.
Figure 1 Sources of External Funds for Nonfinancial Businesses: A Comparison of the United States with Germany, Japan, and Canada Source: Andreas Hackethal and Reinhard H. Schmidt, “Financing Patterns: Measurement Concepts and Empirical Results,” Johann Wolfgang Goethe-Universitat Working Paper No. 125, January 2004. The data are from 1970–2000 and are gross flows as percentage of the total, not including trade and other credit data, which are not available.
Basic Facts about Financial Structure Throughout the World • Stocks are not the most important sources of external financing for businesses. • Issuing marketable debt and equity securities is not the primary way in which businesses finance their operations. • Indirect finance is many times more important than direct finance • Financial intermediaries, particularly banks, are the most important source of external funds used to finance businesses.
Basic Facts about Financial Structure Throughout the World • The financial system is among the most heavily regulated sectors of the economy. • Only large, well-established corporations have easy access to securities markets to finance their activities. • Collateral is a prevalent feature of debt contracts for both households and businesses. • Debt contracts are extremely complicated legal documents that place substantial restrictive covenants on borrowers.
The Lemons Problem: How Adverse Selection Influences Financial Structure • If quality cannot be assessed, the buyer is willing to pay at most a price that reflects the average quality. • Sellers of good quality items will not want to sell at the price for average quality. • The buyer will decide not to buy at all because all that is left in the market is poor quality items. • This problem explains fact 2 and partially explains fact 1.
Tools to Help Solve Adverse Selection Problems • Private production and sale of information • Free-rider problem • Government regulation to increase information • Not always works to solve the adverse selection problem, explains Fact 5 • Financial intermediation • Explains facts 3, 4, & 6 • Collateral and net worth • Explains fact 7