Download
1 / 28
280 likes | 302 Views
Explore the journey from pattern recognition to ecological forecasting in biology and NASA's biodiversity research. Reflecting on historical perspectives and assessing current models and data, this meeting in 2005 delves into the intersection of evolutionary processes, predictive science, and environmental dynamics.

E N D
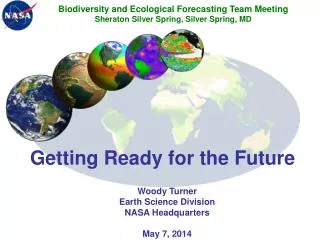
The Dance of Pattern & Process along the Road to PredictionChange & its Prediction in BiologyorNASA Biodiversity Research to Ecological Forecasting Woody Turner Biodiversity & Ecological Forecasting Team Meeting Westin Grand Hotel Washington, DC August 29, 2005
“Nothing has changed since the Greeks.” (Mary Helen Lowry, 1978) On the origin of species over 2300 years ago Aristotle 384-322 BC Empedocles c.495-c.435 BC “Another matter which must not be passed over without consideration is, whether the proper subject of our exposition is that with which the ancient writers concerned themselves, namely, what is the process of formation of each animal; or whether it is not rather, what are the characters of a given creature when formed. … For the process of evolution is for the sake of the thing finally evolved, and not this for the sake of the process. Empedocles, then, was in error when he said that many of the characters presented by animals were merely the results of incidental occurrences during their development;….” (Aristotle, De Partibus Animalium Book I, Chapter 1)
The concept of pattern or regularity is central to science. Pattern implies some sort of repetition…. The existence of repetition means some prediction is possible—having witnessed an event once, we can partially predict its future course when it repeats itself. Robert MacArthur in Geographical Ecology 1972
A Fundamental Challenge for Biology (http://ccinfo.ims.ac.jp/periodic/periodic.jpg)
Forecasting’s Legacy, e.g.: Weather • 340 BC: Aristotle’s Meteorologica • 1590s: Galileo’s thermometer • 1643: Torricelli’s barometer • 1860s: Telegraphs link weather stations • 1904-1922: Numerical weather forecasts • 1920s: Invention of the radiosonde • 1960s: First meteorological satellites & improved hurricane warnings • 1980s-1990s: Coupling of atmosphere/ocean/land surface models (SiB, BATSbiophysics) & early climate forecasts (ENSO predictions) • Mid to Late 1990s: Dynamic Global Vegetation Models for GCMs (e.g.: LPJ, Triffid, IBIS)
A Plethora of Biodiversity Data GenBank Forest Inventory and Analysis National Program IUCN Red List World Database on Protected Areas The Species Analyst Global Mammal Assessment
Models allow: • Assimilation of data from a number of sources/platforms • Translation of our understanding of physical & ecological processes into numerical form • Tests of our understanding of these processes in the form of predictions
ESMF: A Tool for Model Coupling (slide from NASA/Don Anderson)
Two of Science’s Top 25 Questions Systems approach. Circuit diagrams help clarify nerve cell functions. Science, Vol 309, 1 July 2005 > What Determines Species Diversity? CREDIT: MICHAEL T. SHIPLEY > How Will Big Pictures Emerge From a Sea of Biological Data? “New institutions around the world are gathering interdisciplinary teams of biologists, mathematicians, and computer specialists to help promote systems biology approaches” – Sounds a little like ESMF
Some Other Big Questions • How does climate variability affect the abundance of organisms? • How does climate change affect the distribution of organisms? • Are the organisms in communities fungible, e.g.: how stable are trophic webs at retaining their function? • How does biodiversity relate to the functioning of ecosystems & what are the effects of spatial scale? • From all of the above, what are the hottest of the hot spots for retaining maximum species diversity? • What are the best RS proxies for ecosystem diversity and ecosystem health (e.g., NDVI, NPP, soil moisture, SST/SSH & location of fronts, vegetation structural complexity, rates of disturbance, rates of upwelling, etc.)? And what scales are necessary? • Can we catch evolution in action by first correlating environmental changes at landscape/broader scales with genomic/proteomic changes?
Outside In: Niche Definition + Statistics (with thanks to Robert MacArthur) Productivity Patterns of Species Diversity Environmental Stability (e.g., Climate) Habitat Structure
Using Climate (Temperature & Moisture) to Predict Vegetation: Holdridge Life Zones (http://www.icsu-scope.org/downloadpubs/scope56/image/Fig16.1.gif)
The Physical Drivers of Life Nemani et al. 2003. Science 300:1560–1563.
Inside Out: Physiology/Energetics to Niche Energy Budget = f ( Feeding, Resting, Migratory Flight) Challenge: Can we link “Outside In” & “Inside Out” Approaches? (Farmer and Wiens, 1998) Rn - H - lE + M = 0 (figures courtesy of GSFC/Jim Smith)
Biological Drivers (e.g., competition & predation): Trophic Models To Understand Relationships Among Organisms http://www.chadevans.co.uk/asite/Alevel/u03/ln/energyflow2_files/image005.gif Little Rock Lake in Wisconsin; produced by Neo D. Martinez of San Francisco State University, Romberg Tiburon Center for Environmental Studies
Big Questions: Biodiversity & Ecosystem Function (& Scale) Waide et al. surveyed 200 relationships between species richness and productivity in different systems (aquatic and terrestrial) and found 30% unimodal, 26% positive linear, 12% negative linear, and 32% not significant. (R.B. Waide et al. in Annu. Rev. Ecol. Syst. 1999, 30:257-300) Species Richness Species Richness NPP NPP Issue of scale? At smaller scales see more niche partitioning & competition effects while at larger scales see more environmental effects (“the good life”)?—Melinda Smith at ESA Annual Mtg. 2005 Or is it a matter of Experimental systems vs. Natural systems?—Tom Stohlgren at ESA Annual Mtg. 2005 Non- Native Species Richness Non- Native Species Richness Native Species Richness Native Species Richness (backdrop: http://cedarcreek.umn.edu/research/biodiversity.html)
Big Question: Climate Variability & Abundance (Source: UME/Fei Chai)
Big Question: Disturbance & Trophic Web Stability Food Webs Are Dynamic. The Players Change But The Plot Remains. The food web of Tuesday Lake, 1984. The width of the horizontal bars shows the body mass (log10 kg), number (log10 individuals per m3), and biomass (log10 kg/m3), respectively, of each species. The vertical positions of the species show trophic height (20). Despite a major change in species composition, following a manipulation, this energetic setup of the food web remained roughly the same (19). T. Jonsson, J. E. Cohen, S. R. Carpenter, Adv. Ecol. Res. 36, 1 (2005) cited in Science by de Ruiter et al. (2005) 309:68-71.
Where To? Feedbacks to climate & us start here. Helicobacterium pylorii Genome from: http://biocrs.biomed.brown.edu/Books/Chapters/Ch%2038/Pylori-Genome.gif (from USGS Global Visualization Viewer) A Grand Synthesis for the 21st Century
Grand Challenge: Understanding this Variety BIOGEOCHEMISTRY BIODIVERSITY “Terra Incognita” In understanding lies the road to prediction (e.g.: if we want to understand the biogeochemical cycling of carbon &/or other elemental cycling, we need to know other half of ecosystem equation)
Integrated global analyses Report Carbon Cycle and Ecosystems Roadmap Human-Ecosystems-Climate Interactions (Model-Data Fusion, Assimilation); Global Air-Sea Flux Sub-regional sources/sinks Funded T High-Resolution Atmospheric CO2 Unfunded Southern Ocean Carbon Program, Air-Sea CO2 Flux Process controls; errors in sink reduced Partnership Models w/improved ecosystem functions T= Technology development T Physiology & Functional Types Reduced flux uncertainties; coastal carbon dynamics Coastal Carbon = Field Campaign Global Ocean Carbon / Particle Abundance Reduced flux uncertainties; global carbon dynamics Goals: Global productivity and land cover change at fine resolution; biomass and carbon fluxes quantified; useful ecological forecasts and improved climate change projections T Vegetation 3-D Structure, Biomass, & Disturbance Terrestrial carbon stocks & species habitat characterized Global CH4;Wetlands, Flooding & Permafrost CH4 sources characterized and quantified Knowledge Base Global Atmospheric CO2 (OCO) Regional carbon sources/sinks quantified for planet N. American Carbon Program N. America’s carbon budget quantified Land Use Change in Amazonia Effects of tropical deforestation quantified; uncertainties in tropical carbon source reduced 2002: Global productivity and land cover resolution coarse; Large uncertainties in biomass, fluxes, disturbance, and coastal events Models & Computing Capacity Process Understanding Case Studies Improvements: P Land Cover (Landsat) LDCM Land Cover (OLI) Systematic Observations Ocean Color (SeaWiFS, MODIS) Ocean/Land (VIIRS/NPP) Ocean/Land (VIIRS/NPOESS) Vegetation, Fire (AVHRR, MODIS) Vegetation (AVHRR, MODIS) IPCC IPCC 2008 2010 2012 2014 2015 2002 2004 2006 Global C Cycle Global C Cycle NA Carbon NA Carbon
Ecological Forecasting Roadmap “If-Then” Scenarios for Ecosystem Responses to Change/Disturbance Integration of remotely-sensed data with various model types, e.g.: ecosystem, ecological niche, population & habitat viability, biogeography, biogeochemistry, & regional ocean & atmospheric models -- as well as the development of new predictive models Species Distribution Forecasting System > biodiversity/stability/ productivity links Ongoing global land cover change product; global precipitation data Soil surface moisture, sea surface salinity, global river discharge measurements Species distribution models with improved accuracy Operational SERVIR, Protected Areas Management System, & Marine Fisheries Forecasting System DSS’s Vegetation structure & disturbance from active sensors; new data on physiology & functional groups (hyperspectral/fluorescence) Prototype Marine Fisheries Forecasting System DSS for fisheries management; also Protected Areas Management System DSS incorporating species habitat & demographic data into a planning tool Regional ocean models coupled to ecosystem models; global land cover change product Socioeconomic Impact Initial operation of Regional Monitoring & Visualization System DSS (SERVIR) for environmental management & sustainable development in Central America Prototype predictive models linking remotely-sensed environmental parameters to changes in terrestrial & aquatic ecosystems Current trajectory Operational ecological forecasting systems supporting environmental & natural resource management for sustainable development Assessment of land cover change/climate impacts on ecosystems EOS & global land cover observations; early coupling of regional climate & ecosystem models Steady improvement in models linking functional, structural, spatial, & temporal environmental measurements (ongoing measurements include: land cover, ocean color, primary productivity) SRTM TRMM Landsat 7 Terra Aqua NPP/VIIRS Aquarius GPM NPOESS HYDROS 2009 2003 2011 2013 2007 2005
Ecological Forecasting:Observations & Models for Global Management EARTH SYSTEM MODELS • Ecological Niche(GARP) • Scalable spatio-temporal models a la NREL • Regional Ocean Models & Empirical Atmospheric Models coupled with ecosystem trophic models • Ecosystem (ED, CASA) • Population & Habitat Viability Assessment (VORTEX, RAMAS GIS) • Biogeography (MAPSS, BIOME3, DOLY) • Biogeochemistry (BIOME-BGC, CENTURY, TEM) DECISION SUPPORT TOOLS SERVIR (Spanish acronym for Regional Visualization & Monitoring System) Predictions Predictions • Monitor changes in land cover, weather, & fires to assist the sustainable management of the Mesoamerican Biological Corridor VALUE & BENEFITS • Species Distributions • Ecosystem Fluxes • Ecosystem Productivity • Population Ecology • Land Cover Change • Management of a global hotspot of biodiversity, i.e. Mesoamerica, at a regional scale through the coordination of the activities of 7 countries - a model for other regions. • Predict the impacts of changing land use patterns & climate on the ecosystem services that support all human enterprises. • Develop ecological forecasts with reliable assessments of error. (example models) Protected Area Management (with VISTA & TOPS) • Coordinate multi-NGO effort to pool resources for monitoring protected areas per CBD 2010 goal • Link to President’s illegal logging initiative & CBFP Data • Land Cover/Land Use & Disturbances (e.g., fire) • Species Composition • Biomass/Productivity • Phenology • Vegetation Structure • Elevation • Surface Temperature • SST, SSH, Circulation, & Salinity • Atmospheric Temp. • Soil Moisture • Precipitation • Winds EARTH OBSERVATORIES • Land cover:MODIS, AVHRR, Landsat, ASTER, ALI, Hyperion, IKONOS/QuickBird • Topography/Vegetation Structure:SRTM, ASTER, IKONOS, LVIS, SLICER, Radars • Primary Productivity/Phenology:AVHRR, SeaWiFS, MODIS, Landsat, ASTER, ALI, Hyperion, IKONOS, QuickBird, AVIRIS • Atmosphere/Climate:AIRS/AMSU/HSB, TRMM (PR, LIS, TMI), AVHRR, MODIS, MISR, CERES, QuikScat • Ocean:AVHRR, SeaWiFS, MODIS, TOPEX/Poseidon, JASON,AQUARIUS • Soils:AMSR-E, AIRSAR • Impact of ENSO & PDO Events on Fisheries • Combine physical ocean models & ecosystem trophic-level models to predict impacts of climatological changes on regional fisheries Observations 60 *Future Mission January 25, 2005
Goals for Meeting • Bring people together • Suggest additional questions • Define technological needs • Make programmatic connections • Among research activities • Between research & educational activities • Between projects & Center activities • Among agencies