Download
1 / 27
270 likes | 395 Views
Hurricane Forecast Improvement Project (HFIP): Where do we stand after 3 years?. Bob Gall – HFIP Development Manager Fred Toepfer—HFIP Project manager Frank Marks – HFIP Research Lead Ed Rappaport – HFIP Operations Lead March 6, 2013. The HFIP Project – Vision/Goals. Vision

E N D
Hurricane Forecast Improvement Project (HFIP):Where do we stand after 3 years? Bob Gall – HFIP Development Manager Fred Toepfer—HFIP Project manager Frank Marks – HFIP Research Lead Ed Rappaport – HFIP Operations Lead March 6, 2013
The HFIP Project – Vision/Goals • Vision • Organize the hurricane community to dramatically improve numerical forecast guidance to NHC in 5-10 years • Goals • Reduce numerical forecast errors in track and intensity by 20% in 5 years, 50% in 10 years • Extend forecasts to 7 days • Increase probability of detecting rapid intensification at day 1 to 90% and 60% at day 5
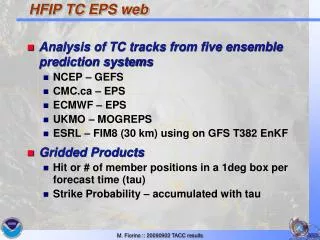
HFIP Overall Strategy Use global models at as high a resolution as possible to forecast track out to 7 days Use regional models at 1-3 km resolution to predict inner core structure to meet intensity goals out to 5 days including rapid intensification Hybrid DA for both regional and global using as much satellite and aircraft data as possible Both regional and global models run as ensembles Statistical post processing of model output to further increase forecast skill
Track Error of Models (2010-2011)(% Improvement over HFIP baseline)
How are we doing? • The HFIP goals are for model products delivered from NCEP to NHC. • The delivery date for these goals is hurricane season 2014 • The following show the operational models (Global and Regional) performance for hurricane track and intensity in the Atlantic for latest hurricane season (2012)
Comparison of 2012 NCEP Operational Models to the 5 Year HFIP Goal: Track GFS 5-year skill goal Baseline skill HWRF GFDL
Comparison of 2012 NCEP Operational Models to the 5 Year HFIP Goal: Intensity HFIP 5 year Goal Baseline skill GFS GFDL HWRF
ECMWF FSU TVCA UKMET NOGAPS GFS AHW FIM HWRF Canadian Model GFDL
IntensityConsensus GFDL SPC3 FSU LGEM DSHP HWRF Wisconsin AHW TC-COAMPS
2012 HWRF Upgrades • The upgrade to the 3km triple-nested HWRF is a result of multi-agency efforts under HFIP support • EMC - Computational tuning to speed up the model, nest motion algorithm, physics improvements, 3km initialization and pre-implementation T&E • HRD/AOML - multi-moving nest, nest motion algorithm, PBL upgrades, interpolation routines for initialization and others. • DTC - code management and maintain subversion repository • ESRL - Physics sensitivity tests and idealized capability • NHC - Diagnose the HWRF pre-implementation results • URI - 1D ocean coupling in Eastern Pacific basin
2012 3km HWRF Operational Upgrade Summary • Significant Improvements of H212 • Track/intensity forecast skills for 2011/2010 seasons on Atlantic basin 20-25% improvement against HOPS • Track forecast skills of H212 of Eastern Pacific basin maximum 25% over the HOPS in 2011 season, but little degradation at day 4 and 5 in 2010 season mainly due to Hurricane Frank • Intensity of 2011 EP basin with over 40% to HOPS. Significant improvements in intensity bias is noted for both Atlantic and Eastern Pacific, for both 2010-2011 seasons. • The storm structure in terms of storm size and PBL height significantly improved • Much improved wind-pressure relationship in high wind speed regime ATL Tracks HOPS: oper. HWRF H212: 2012 HWRF ATL Intensity HOPS: oper. HWRF H212: 2012 HWRF 20-25% improvement
2.2.2 (EMC) TDR assimilation OPR HWRF HWRF TDR Impact of TDR data assimilation to hurricane intensity forecast Cross section at initial time
Impact of TDR Data In Operational HWRF Track Error Intensity Error Without TDR Without TDR With TDR With TDR
Comparison of 2012 NCEP Operational Models to the 5 Year HFIP Goal: Track
Comparison of 2012 NCEP Operational Models to the 5 Year HFIP Goal: Intensity
Statistical Post Processing • Statistical Post Processing can add skill to dynamical forecasts. • There are a number of techniques based on ensembles or individual models. • One method is shown in the following figure • From the FSU Multi-Model Ensemble (MMEN) which forms a weighted mean of the many global and regional models run both operationally and by HFIP in real time.
Verification of model genesis for operational global models • All models have a bias towards over-prediction, caused by both false alarms as well as genesis occurring in the forecast long (>>48h) before observed genesis. • 4-ensemble consensus close to reliable up through 50-60%.