Download
1 / 23
230 likes | 466 Views
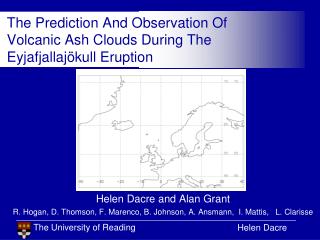
The Prediction And Observation Of Volcanic Ash Clouds During The Eyjafjallajökull Eruption. Helen Dacre and Alan Grant R. Hogan, D. Thomson, F. Marenco, B. Johnson, A. Ansmann, I. Mattis, L. Clarisse. Introduction. Motivation. EUROCONTROL report from 14 - 20 April:

E N D
The Prediction And Observation Of Volcanic Ash Clouds During TheEyjafjallajökull Eruption Helen Dacre and Alan Grant R. Hogan, D. Thomson, F. Marenco, B. Johnson, A. Ansmann, I. Mattis, L. Clarisse
Motivation EUROCONTROL report from 14 - 20 April: • 75% of European airspace closed • 100,000 flights cancelled • 10 million passenger journeys affected • 7000 flights cancelled up to 18 May
Talk Outline AIM: to compare NAME simulations of ash clouds with observations of ash clouds with a view to estimating the distal fine ash fraction (DFAF) • Qualitative model evaluation • Quantitative model evaluation • Plume height • Vertical distribution of ash • Ash size distribution • Future volcanic ash predictions
Operational VATD Modelling Plume height (8.5km) MODEL OUTPUT INPUT Vertical ash distribution (uniform) Gardner et al.1995
Qualitative Spatial Verification 12 UTC 16th April IASI Volcanic Ash Lieven Clarisse MODIS visible 12:24UTC 16th April 10 UTC 16th April
Quantitative Verification 50 km from volcano (Thor Thordarson) • DFAF is defined as the % of the total emitted mass that is carried by small particles (<100μm diameter) and transported long distances (> 1000km) from the volcano
(Petersen and Arason, 2011) 1. Sensitivity of DfAF to plume height fluctuations Mountain Missing Cloud Comparison with ground-based lidars
DFAF at Leipzig and Chilbolton on 16th April Albert Ansmann, Ina Mattis Robin Hogan DFAF = 4% DFAF = 3%
Concentrated Uniform 2. Sensitivity of DFAF to vertical distribution of ash Comparison with airborne lidars
DFAF on 17th May Observed ash layers concentrated uniform uniform concentrated uniform DFAF = 2.7% concentrated DFAF =1.6% Alan Grant, Franco Marenco
Comparison for all flights DFAF = 2% Alan Grant
3. Sensitivity of DfAF to EFFective ash size distribution Comparison with in-situ aerosol measurements
Distal FAF from in-situ measurements Average concentration on 14th May Size distribution on flight Effective ash size distribution 14th May original DFAF = 2.8% 14th May new DFAF = 2.2% Ben Johnson
DFAF Summary 3.5%
Future Volcanic Eruptions GENERAL • NAME identifies observed ash layers subject to possible timing and positioning errors due to meteorology • Observed ash layers are thinner and lower than simulated layers SOURCE PARAMETER UNCERTAINTY • Plume height - necessary to represent short-term fluctuations • Vertical distribution - no best profile but related to activity • Ash size distribution - Large percentage of < 10µm particles • DFAF ~ 3.5% of the erupted mass was in ash particles small enough to allow long-range transport
Ash Particles in Iceland 50 km from volcano (Thor Thordarson) 100µm
Fine Ash Fraction at Chilbolton on 16th April faf = 2% Robin Hogan
Fine Ash Particle Size Distribution Size distribution on flight Effective-source size distribution 14th May 14th May original faf = 2.8% new faf = 2.2% 17th May 17th May original faf = 7.3% new faf = 3.4%