Download
1 / 26
260 likes | 349 Views
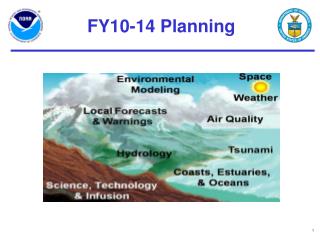
FY10-14 Planning. Vision for 2015. NOAA is closer to its customers and better able to respond to severe events. NOAA information is routinely incorporated into critical decision making. Improved communication of uncertainty and risk associated with high impact events

E N D
Vision for 2015 • NOAA is closer to its customers and better able to respond to severe events. • NOAA information is routinely incorporated into critical decision making. • Improved communication of uncertainty and risk associated with high impact events • Integrated information presented in useful formats (e.g., geo-referenced, appropriate temporal and spatial resolution, probabilistic, etc.) • NOAA helps communities to become more resilient to severe events.
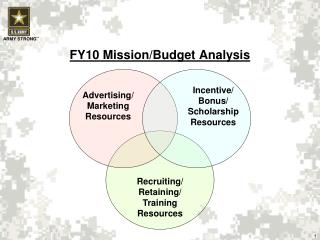
High Impact Operations Planning FY 10-14 Objectives • Optimal use of state-of-the-art science and technology • A skilled and diversely specialized workforce able to provide most effective response to high impact events. • Improved integration of NOAA’s environmental information in the operational setting and in the resulting products and services.
High Impact Operations Planning FY 10-14 Approach • Hazard Resiliency • Decision Aids • Test Beds/ Proving Grounds • Warn-On-Forecast • Probabilistic Work (Ensembles) • Integrated Environmental Information • NOAA/NIST Partnership • Operations • Integrated Services • Training • IMET Expansion • Transitions • Preparedness • Situational Awareness and Response R&D • Enhanced Outreach • Science/Tech Infusion to Improve Core Mission Functions • Radar • TDWR • MPAR • NEXRAD NPI • VORTEX II • Operations • Training • Transitions • AWIPS II • Mass Dissemination Systems
FY10-14 Planning Challenges • Obs Requirements • Performance Measures • NGATS • Sustaining of Critical Systems • NEXRAD O&M • ASOS O&M • Wind Profiler • Weather Radio
Current R&D • The following slides show examples of OAR initiatives supporting high impact operations and integrated services. • This is not a complete survey – just a sampling to show the opportunities for planning on the service delivery side.
The NMQ Project The National Mosaic and QPE (NMQ) Project is a framework for scientific and community wide convergence towards high resolution, accurate quantitative precipitation estimation (QPE) and very short term quantitative precipitation forecast (VSTQPF) for all scales, seasons and geography. The NMQ is a real-time, around-the-clock, data infusion and applications development and evaluation environment that includes data quality control, automatic algorithm comparison and verification. A National Testbed for MSQPE and VSTQPF
Upper Air Satellite Lightning Sfc Obs Models Integrated approach to precipitation monitoring and prediction for water resource management and flood prediction. Radar Networks
Upper Air Satellite Lightning Sfc Obs Models Seamless High Resolution Quantitative Precipitation Estimation - Incremental Complexity Radar Networks 1x1 km North America Precipitation Estimation Update Every 5 minutes CONUS
Upper Air Satellite Lightning Sfc Obs Models NMQ System Data Ingest/Remap Quality Control Data Integration National 3D Mosaic Radars Networks Real Time QPE & VSTQPF Development and Run Environment HMT Continuous (tilt by tilt) ingest and processing of base radar data from nearly 170 - 10 and 5 cm radars Operational Infusion and Enhancement Verification and Assessment(QVS)
The future evolution of warning decision-making science “Warn on detection” (deterministic) Forecaster-based uncertainty NWP “Warn on forecast” Blended statistics NWP WRF storm typing Statistics-based uncertainty Storm-scale NWP EnKF analysis / storm typing Present 2010 (± 2 yr) 2017 (± 5 yr) 2025 (± 10 yr) WSR-88D Dual-Polarization Radar Phased Array Radar Existing storms Newly initiated convection Forecast convection (doesn’t yet exist)
Extrapolative Forecast Techniques Radar Multi-radar/multi-sensor environment (e.g. WDSS-II) Rotation Tracks Surface • Numerical models • Diagnostic Applications Analysis 1-hr forecast Satellite 2-hr max MESH • Lightning Enhanced verification of severe storms “Hail Swath” with dense verification Probabilistic Warning Guidance Existing building blocks:
Initial threat area 30 min. threat probability 1 hr threat swath (accum) Est. time of arrival Probabilistic Warning Guidance Future building blocks: • Dual-pol radar output • Expanded enhanced severe storm verification • Scientific advancement: Straight-line winds • Climatological storm type statistics • Greater computational ability
NOAA Hazardous Weather TestbedEFP - SPC/NSSL Spring Experiments • Recent Spring Experiments examined Short-Range Ensembles and convection-allowing WRF models • Can new NWP concepts provide useful guidance for severe weather forecasting? • Partnerships with EMC, NCAR, and OU-CAPS • Developed & tested many new SREF and high resolution WRF guidance tools that were subsequently transferred to operations SREF Spaghetti Chart 4.5 km WRF-NMM Reflectivity
4 km WRF-ARW 4.5 km WRF-NMM 2 km WRF-ARW RADAR VERIFICATION
WRF 24 hr Reflectivity Forecasts Valid 00z 26 May 2005 ARW4 ARW2 NMM4 RADAR 4.5 km WRF-NMM 4 km WRF-ARW 2 km WRF-ARW RADAR VERIFICATION
Proposed HWT Activities:EFP-Spring 2007 • Annual SPC/NSSL Spring Experiment (EFP) • First year of multi-year effort (2007-2009) • Contributing Partners: SPC, NSSL, CAPS, EMC, NCAR, OUN (unique diversity of backgrounds and expertise) • Apply cutting edge science and technology leading to improved NWS services • Scientific Objectives: • Improve high resolution WRF models • Further explore impacts of physics (PBL, microphysics, etc.) • Pre-convective environment, PBL sounding structure, and convective storm development • Impact of resolution on WRF simulation of stormscale structures (e.g., supercells, bow echoes, etc.)
Proposed HWT Activities:EFP-Spring 2007 • Annual SPC/NSSL Spring Experiment (EFP) • Scientific Objectives (cont’d) • Begin to explore utility of a daily 4 km convection-allowing 10 member WRF ensemble for short-term (12-30h) prediction of severe convection • Investigate IC versus physics in convection-allowing ensemble • Explore impact of physics on ensemble performance • Environment; convective initiation, intensity and mode • Compare to “higher” resolution deterministic WRF • 2 km WRF (CAPS) and 3 km WRF (NCAR and EMC) • Begin developing interrogation tools to extract ensemble-based information for hazardous weather events • A “baby step” in early testing of Warn on Forecast-type concept • Probabilistic information from convection-allowing ensemble
Probabilistic Forecasting • Two foci: • How to develop better ensemble systems • Multi-physics • Initial condition perturbations • Ensemble data assimilation • Postprocessing of ensemble data
Postprocessing • Using various methods to postprocess ensemble data leads to forecasts that are better than MOS for T, Td, and PQPF
Severe weather warnings Increased lead time having dense information content 1 of 5 Warn on “Forecast” in 2020 Manageable Complexity? • Now: NWS warning operation warnings (~ 13 min lead time) • 3-6 hours: Large-scale weather prediction model output • 1-3 hours: Monitor surface and satellite for initiation • 0-1 hour: Warn from a single Doppler radar, spotter reports… • 2020: NWS warning operations (~30+ min lead time?) • 3-6 hours: Ultra-high resolution model output (e.g., CONUS@1 km) • 1-3 hours: State and local mesonets, micronets, profilers, ultra-high-res satellite • Other exotic data sources (e.g., UAV’s?) • 0- 1 hour: Multiple radars in metropolitan areas (public and private) • 5 - 10x more data per radar (PAR, polarization variables) • Live streaming video from news media and public • Gap filling, mobile radars (public and private?) Overwhelming Complexity! Storm-Scale NWP Probabilistic 0-1 hour forecasts of individual storms, potential damage swaths from tornadoes, wind, and hail Spotter Public reports NWS PAR Surface Ob 2020: “Fire Hydrant” Data Stream Mesoscale Analysis/Fcst Forecaster GapF radar TV Radar OAR PPES BriefingDRAFT - PREDECISIONAL GIS Information Satellite NSSL Warn on Forecast Briefing March 5, 2007
2 of 5 Warn on Forecast in 2020: What might it look like? Radar and Initial Forecast at 2100 CST Radar at 2130 CST: Accurate Forecast Probabilistic tornado warning: Forecast looks on track, storm circulation (hook echo) is tracking along centerline of highest tornadic probabilities An ensemble of storm-scale NWP models predict the path of a potentially tornadic supercell during the next 1 hour. The ensemble is used to create a probabilistic tornado warning. Most Likely Tornado Path Most Likely Tornado Path Developing thunderstorm 30% 30% 50% 50% 70% 70% T=2200 CST T=2200 CST T=2150 T=2150 T=2140 T=2140 T=2130 T=2130 T=2120 CST T=2120 CST NSSL Warn on Forecast Briefing March 5, 2007
3 of 5 Warn on Forecast 2020: Continuously updating the forecast based on current observations and trends…. Radar at 2130 CST: Forecast in error! New forecast created using 2130 radar data New Tornado Probability Path New Most Likely Tornado Path 10% 20% 30% 30% 40% T=2210 CST 50% T=2200 70% T=2150 T=2200 CST T=2140 Old Tornado Probability Path T=2140 Current radar observation T=2130 CST T=2120 CST Storm is moving more northerly and slightly faster! Tornadic circulation is farther NW! NSSL Warn on Forecast Briefing March 5, 2007
4 of 5 WoF 2020 Vision: Ultra High-Resolution Radar Data and Numerical Models Storm-scale Numerical Weather Prediction WSR-88D WSR-88D Data Quality Control Data Assimilation Storm-scale Analysis Storm-scale Forecast Visualization TDWR TDWR Model Analysis + Forecast! PAR PAR Reflectivity Radial Velocity NSSL Warn on Forecast Briefing March 5, 2007
5 of 5 Science and Technology Enabling the Change:Storm-scale Numerical Weather Prediction 1975 NWP Model Grid North Texas Region (DFW area) 1975: was represented by a single grid point in our NWP models North Texas Region (DFW area) 2007: now can be represented by ~ 10,000 grid points Can resolve a single tornadic storm.. 1975 2007 DFW Tornadic Supercell Model grid resolution ~ 2 km Model grid resolution ~ 200 km 30 years of atmospheric research + computers which are 10 million times faster NSSL Warn on Forecast Briefing March 5, 2007