Download

1 / 52
540 likes | 846 Views
Magnetic resonance imaging in biomedical research. Igor Serša Ljubljana, 2011. History of Nuclear Magnetic Resonance (NMR). Purcell, Torrey, Pound (1946) Bloch, Hansen, Packard (1946). 1D NMR spectroscopy (CW). Pulsed NMR. Emergence of computers. P.C. Lauterbur (1973)

E N D
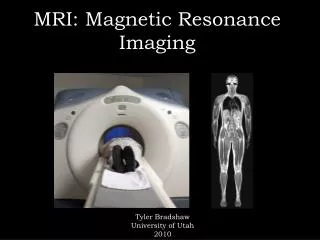
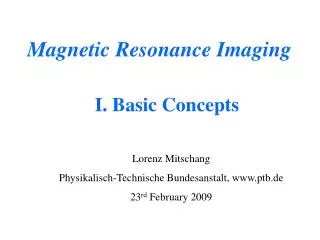
Magnetic resonance imaging in biomedical research Igor Serša Ljubljana, 2011
History of Nuclear Magnetic Resonance (NMR) Purcell, Torrey, Pound (1946) Bloch, Hansen, Packard (1946) 1D NMR spectroscopy (CW) Pulsed NMR Emergence of computers P.C. Lauterbur (1973) P. Mansfield (1973) R.R. Ernst (1975) Biomedcial use of NMR, magnetic resonance imaging (MRI) NQR , Solid state NMR, NMR in Eart‘s field Multidimensional NMR spectroscopy
Nobel Laureates in MRI R.R. Ernst 1991 chemistry For a discovery of multidimensional NMR and setting foundations of Fourier transform MRI methods P. Mansfield 2003 medicine For the development of fast MRI (Echo planar imaging) P.C. Lauterbur 2003 medicine First who succeded to get a MR image
MRI in earlydays Lauterbur, P.C. (1973). Nature 242, 190.
MRI statistics • MRI Equipment Market of 5.5 Billion Dollars in 2010 • 91.2 MRI exams are performed per 1,000 population per year in USA • 41.3 MRI exams are performed per 1,000 population per year in OECD countries • 22.2 MRI exams are performed per 1,000 population per year in Slovenia • 7,950 MRI scanners in USA (25.9 MRI scanners per million population) • 18 MRI scanners in Slovenia (9 MRI scanners per million population) Opening ceremony of the last MRI scanner in Slovenia (MurskaSobota) Investment of 1,200,000 €
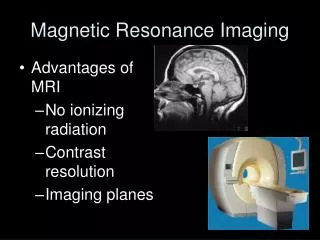
MRI systems Clinical MRI system Use in radiology B0 = 1,5 T, opening 60 cm High-reolution NMR/MRI system Use in chemistry, MR microscopy B0 = 7 T, opening 3 cm
Nuclear precession B0 Mz RF pulse B1field M0 M0/2 t T1ln(2) 100 MHz proton precession frequency in 2.35 T
M w Ui MR signal FID signal U0 Ui t FT w spectrum
Magnetic field gradients B0 x + Gx x x = B Sedle coil Maxwell pair x
MR imaging in one dimension B B x x w0 w w
MR imaging in two dimensions back projection reconstruction method
Pulse sequences p p/2 RF AQ Gx Gy Gz TE
MRI in biomedicine Research on clinical MR scanners Rsearch on other MRI systems • MR microscopy • MRI of wood • Pharmaceutical studies • Porous materials • Biologoical Tissue properties • MRI of food • Hardware development • RF coils • Gradient coils • Amplifiers • Spectrometers • Imaging sequences • Standard MRI • Contrast • Speed • Resolution • Spectroscopic • Data processing • New reconstruction algorithms • Image filtering • Mathematical modelling • Small anaimal MRI • Development of new MRI contrast agents • Study of new drugs
Hardware development • Gradient amplifiers • Gradients up to 45 mT/m • Gradient rise time of 200 T/m/ms • 600 A @ 2000 V = 1.2 MW ! Multi channel RF coils (32 channel head coil) • RF amplifiers • 35 kW • MRI magnets • 1.5 T, 3 T, 7 T • Low weight • Compact dimensions • Low helium consumption
Clinical MR images MRI of spine fMRI Fiber tracking MRI – brain tumors MR angiography DWI - stroke
New reconstructionmethods 0 0 0 0 Sa’ 0 0 0 0 0 0 0 0 Sb’ 0 0 0 0 S = R = 4 0 0 0 0 Sc’ 0 0 0 0 0 0 0 0 Sd’ 0 0 0 0
Small animal MRI Anaesthesia Experimental mice Placement in the probe Resolution Resolution × SNR const($$$) Time Signal Time Noise
Multiple sclerosis model • Mice having Theiler’s Murine Encephalitis Virus infection (TMEV) may develop symptoms similar to that of multiple sclerosis • Intracerebral injection causes demyelinating disease • CD8 cell mediated disease 7 days post infection Cr Cho NAA Before infection MS cord Normal cord T2-weighted images MS lesions (demyelinated choppy structures) appear bright Decrease in NAA/Cr ratio in early stage of MS.
Superparamagnetic labells • USPIO - Ultrasmall Super Paramagnetic Iron Oxide particle: 50 nm in diameter • Highly specific superparamagnetically labeled antibodies: targeted USPIO-s • Venous administration • Signal persists for days, excellent specificity • A single labeled cell can theoretically provide adequate signal to be visualized Superparamagnetic antibodies under scanning electron microscope attached to CD8 cells.
MS lesions detected by CD8 labeling B6 strain mice (acute demyelinating disease, full recovery in 4-6 weeks) Day 0 Day 3 Day 7 Day 21 Day 45
What is MR Microscopy? MR microscopy is essentially identical to conventional MRI (most of MR sequences of clinical MRI can be used) except that resolution is at least an order of magnitude higher. Signal -> Signal / 100 Conventional MRI 1 mm / pixel 2D 10 fold resolution increase 3D 10-100 µm / pixel Signal -> Signal / 1000 MR microscopy
How to compensate the signal loss? • By using stronger magnets • By lowering the sample temperature (not an option) • By signal averaging • By reducing RF coil size RF coils in sizes from 2 mm – 25 mm 7 – 14 T
How to achieve high resolution? By the use of stronger gradients GR Δt 45 mT/m @ 750 A Conventional MRI GR 1500 mT/m @ 60 A MR microscopy Δt
MRI laboratory at JSI 100 MHz (proton frequency) 2.35 T Horizontal bore superconducting magnet Accessories for MR microscopy Top gradients of 250mT/m, RF probes 2-25 mm
Our research using MR microscopy Electric current density imaging NMR of porous materials MRI of wood NMR in studies of thrombolysis Volume selective excitation MRI in pharmaceutical research MRI in dental research http://titan.ijs.si/MRI/index.html
NMR in studies of thrombolysis blood clot magnet 0,7 mm 3 mm 30 mm • ηk = 1.8·ηH20 = 0.0018 Pas • ρk = 1035 kg/m3 0,5 l plazma + rt-PA 3 mm pump Dp = 15 kPa (113 mmHg), arterial system Dp = 3 kPa (22 mmHg), venous system
NMR in studies of thrombolysis Dynamical 2D MR microscopy using spin-echo MRI sequence TE = 12 ms TR = 400 ms SLTH = 2 mm FOV = 20 mm Matrix: 256 x 256 Fast flow 0 min 4 min 8 min 12 min 16 min Slow flow 0 min 4 min 8 min 12 min 16 min
NMR in studies of thrombolysis x 1 T Fast flow Slow flow t S0 S0 S S∞ SERŠA, Igor, TRATAR, Gregor, MIKAC, Urška, BLINC, Aleš. A mathematical model for the dissolution of non-occlusive blood clots in fast tangential blood flow. Biorheology (Oxf.), 2007, vol. 44, p. 1-16.
0 min 36 min NMR in studies of thrombolysis • 3D RARE MRI (fast flow, ∆p = 15 kPa)
5 μm NMR in studies of thrombolysis • Blood clot dissolution progresses radially with regard to the perfusion channel along the clot. • Volume blood flow through the clot is constant. • Mechanical forces to the surface of the clot have viscous origin and are therefore proportional to the shear velocity of blood flow along the clot. Confocal microscopy of thrombolysis F J. W. Weisel, Structure of fibrin: impact on clot stability, J Thromb Haemost 2007 λ 2R∞ 2R
NMR in studies of thrombolysis • Mechanical work needed for the removal of the clot segment is proportional to its volume. • Start of thrombolytic biochemical reactions is delayed (τ) and gradual (Δ) λ Layer of the clot that is well perfused with the thrombolytic agent 2R Layer of the clot that is removed in time dt dR 1/c 1/c∞ t τ Δ
NMR in studies of thrombolysis Perfussion channel profile Thrombolytic time SERŠA, Igor, VIDMAR, Jernej, GROBELNIK, Barbara, MIKAC, Urška, TRATAR, Gregor, BLINC, Aleš. Modelling the effect of laminar axially directed blood flow on the dissolution of non-occlusive blood clots. Phys. Med. Biol., 2007, vol. 52, p. 2969-2985.
Current density imaging Externally applied electric field is used to induce cell permeability by transient or permanent structural changes in membrane The aim of this study was to monitor current densityduring high-voltage electroporation (important for electrode design and positioning)
Current density imaging Electroporation phantom
Current density imaging Effect of electric pulses
Imaging part Current encoding part Current density imaging • Electric pulses • Two 20 ms pulses @ 15 V • Eight 100 μs pulses @ 1000 V CDI calculation 1. Phase is proportional to Bz 2. Ampere law Thin-sample approximation
Current density imaging experiment simulation Electrode setup Phase image 2D current density field
MRI ofwood On a 3m high beech tree, transplanted in a portable pot, a branch of 5mm diameter was topped. The topped branch was then inserted in the RF coil and then in the magnet.
MRI ofwood Pith, xylem rays, early wood vesselsandcambial zone 6 mm 21 mm
Wound Dehydration and dieback new grown tissues Formation of the reaction zone MRI ofwood • Trees do not have a mechanism to heal wounds like higher organisms (animals, humans), i.e., wounds are not gradually replaced by the original tissue. • In trees wounds are simply overgrown by the new tissue, while the wounded tissue slowly degrades.
MRI ofwood Day 1 Day 3 Day 8
MRI ofwood Day 14 Day 28 Day 168
enamel periodontal communications dentin pulp bifurcation root channel MRI in dental research Premolars 1-2 root channels Molars 3-4 root channels (in the literature was reported even up to 7 root channels)
MRI in dental research Root channels are not clearly visible. Root channels after endodontic treatment. • Standard X-ray image corresponds to 2D projection of hard dental tissues (enamel and dentin) into a plane of image. • It is impossible to accurately determine the exact number of root channels since they may overlap in the projection. • Fine details (periodontal communications and anastomosis) cannot be seen due to limited resolution. • X-ray scanning is harmful due to X-ray radiation.
MRI in dental research X-ray image Hard dental tissues are bright on the images, soft tissues cannot be seen. MR image obtained after co-addition of all slices Soft dental tissues are bright on the images, hard tissues cannot be seen. Frontal (bucco-lingual) as well as side (mesio-distal) view is possible.