Download
1 / 39
390 likes | 479 Views
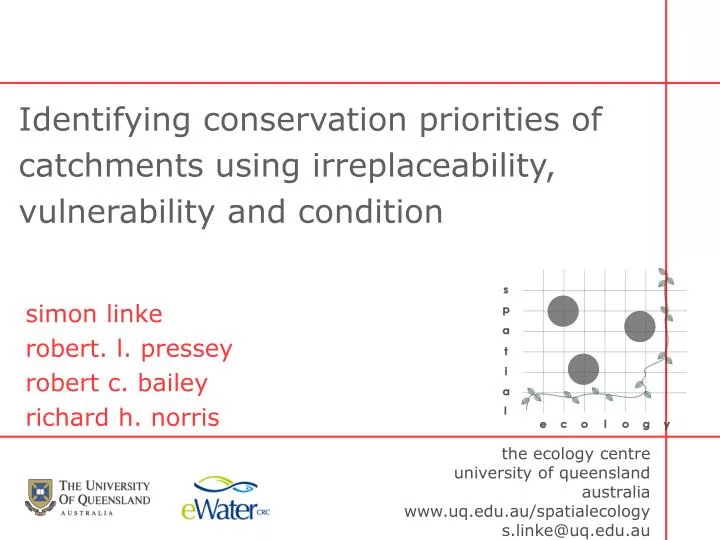
Identifying conservation priorities of catchments using irreplaceability, vulnerability and condition. the ecology centre university of queensland australia www.uq.edu.au/spatialecology s.linke@uq.edu.au. simon linke robert. l. pressey robert c. bailey richard h. norris.

E N D
Identifying conservation priorities of catchments using irreplaceability, vulnerability and condition the ecology centre university of queensland australia www.uq.edu.au/spatialecology s.linke@uq.edu.au simon linke robert. l. pressey robert c. bailey richard h. norris
three key questions in river conservation planning Conservation value Pressure Biodiversity Condition Vulnerability State
three key questions in river conservation planning Conservation value Condition Vulnerability
irreplaceability (conservation value)What is special about a catchment?
conditionWhat is the status of the catchment? dr. bob says: don’t eat the yellow stream
consider all three axes for planning priority: protection priority: restoration high good vulnerability condition low irreplaceability high
irreplaceability (conservation value)What is special about a catchment?
data study victoria (australia): invertebrate taxa as targets
data limitations • we have data for 12%. how to cover the rest?
modeled occurrences: probabilities! • assign a probability of occurrence for every taxon in every subcatchment
predictors: GIS • bailey & linke (in prep.) GIS variables predict macro-invertebrate assemblages as well as local habitat • query out for all subbasins: • catchment descriptors • climate • geomorphology/hypsology • vegetation • geology
generalized additive models Environmental factors Predicted Biota 30% chance of being at test site 70% chance of being at test site
modeling results • 400 taxa at genus/species could be predicted successfully at ROC>0.6
irreplaceability • run heuristic 1000 times with randomly half of the sites taken out • see which catchments end up selected most often • measures: f(frequency of selection), c(contribution to targets)
irreplaceability • run heuristic 1000 times with randomly half of the sites taken out • see which catchments end up selected most often • measures: f(frequency of selection), c(contribution to targets)
irreplaceability • run heuristic 1000 times with randomly half of the sites taken out • see which catchments end up selected most often • measures: f(frequency of selection), c(contribution to targets)
irreplaceability • run heuristic 1000 times with randomly half of the sites taken out • see which catchments end up selected most often • measures: f(frequency of selection), c(contribution to targets) 42% 53% 83% 13%
conditionWhat is the status of the catchment? dr. bob says: don’t eat the yellow stream
condition -> stressor gradients agriculture grazing nutrient load weeds road density forestry sediment load urbanization
condition -> stressor gradients PC 1 agriculture PC 3 forestry PC 2 urban principal components analysis (PCA) agriculture grazing nutrient load weeds road density forestry sediment load urbanization
sediment load (0.36) PC 1: agriculture (51% explained) intensive agriculture (0.41) native vegetation (-.42) acidification (0.37) grazing (0.40) forestry (- 0.40)
2 components allows more intensive use than current landuse If land capability slope soils vulnerable
capability classification(based on Emery (1985)) category 1 – highest capability: low slopes, low erosion and low salinity risk suitable for cultivation, pasture, forestry category 2 – medium capability: medium slopes, moderate erosion. suitable for pasture, forestry category 3 – low capability: steep slopes, high erosion and potentially high salinity suitable for national parks
impact classification(after Norris et al. (2001)) cultivation has a higher impact than sown pasture has a higher impact than native pasture has a higher/equal impact than forestry has a higher impact than conservation
vulnerability by catchment already in the highest impact class -> not vulnerable already protected -> not vulnerable
Management integration high good vulnerability condition low irreplaceability high
focus on restoration high irreplaceability, degraded condition
candidates for river reserves high irreplaceability, still good condition, but high vulnerability
ad-break: eWater river conservation software (ready in 6-12 months)
challenge: integrated catchment planning • consider condition and vulnerability as variables that require cost/effort • priority of action is linked to effort needed • targets can be met in multiple ways -> choose the cheapest/easiest one
proposed framework present condition vulnerability subject to condition and vulnerability target 1 target 2 target n attributes of each catchment
aim: to optimize investments in condition and vulnerability so all targets can be met reservation/’fighting threats’ restoration/improvement possible types of action Condition good bad
the connected nature of rivers (re-visited) investment: restoration • improvement or degradation ‘travels’ downstream • makes optimisation difficult (yet fun)
what have I done so far? • adapted the simulated annealing algorithm to include different levels of investment • ran a trial with 3 (ficticious) species, 13 subcatchments, optimized for condition • simulated annealing gives you the optimal investment
next steps • how can vulnerability be included • both, condition and vulnerability have to be optimised • dynamic problem? Condition is necessary, but for longer • how to put real costs on restoration/protection activities • merge with population models