Download
1 / 38
380 likes | 467 Views
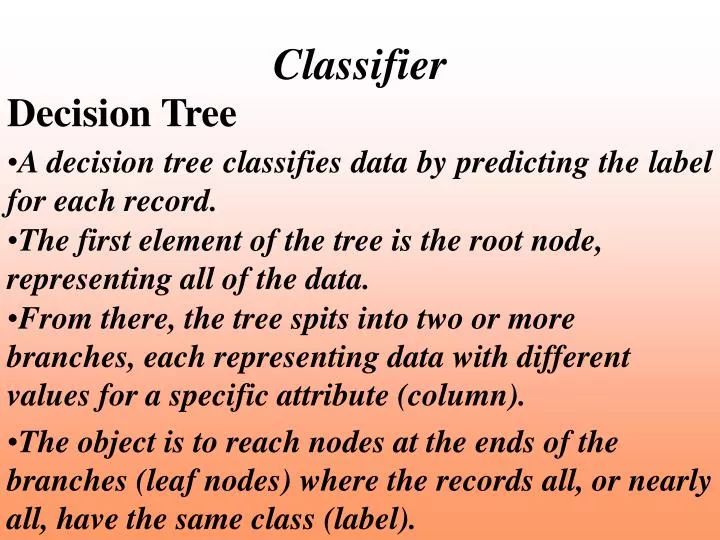
Classifie r. Decision Tree. A decision tree classifies data by predicting the label for each record. The first element of the tree is the root node, representing all of the data.

E N D
Classifier Decision Tree A decision tree classifies data by predicting the label for each record. The first element of the tree is the root node, representing all of the data. From there, the tree spits into two or more branches, each representing data with different values for a specific attribute (column). The object is to reach nodes at the ends of the branches (leaf nodes) where the records all, or nearly all, have the same class (label).
Option Tree Like Decision Tree classifiers, Option Tree classifiers also assign each record to a class. An option tree actually consists of several decision trees. Instead of picking an attribute to split on for the root node, it picks several, and makes a decision tree for each.
Evidence It incorporates an inducer (an algorithm for generating Naïve Bayes models) and a visualizer. Unlike the Decision Table model, the Evidence model assumes that the attributes are independent. Once the classifier is built, the results are displayed in the Evidence Visualizer window.
Decision Table A decision table is a predictive modeling tool that performs classification for more information on classifiers and predictive modeling. A decision table is a hierarchical breakdown of the data, with two attributes at each level of the hierarchy. The Decision Table inducer identifies the most important attributes (columns) for classifying the data, and the accompanying visualizer displays the resulting model graphically as a series of cake charts
Regression Regression is the task of predicting a continuous label value, given a set of descriptive attributes. When a regressor is generated, the Option Tree Visualizer displays the tree. In addition, it can provide valuable insight into the data itself.
VISUALIZATION TOOL • 2D Visualizers • Record. • Statistics. • Box Plots • Histogram. • 3D Visualizers • Scatter • Splat • Tree • Map
Record Visualizer An easy way to become familiar with your selected dataset is to use the Record Viewer to see the database records and the data values within the columns. The records appear in spreadsheet form.
Record Visualizer Supported Operations : • Resize columns • Rearrange columns • Hide Columns • Sort record order by column values • Sort record order by multiple columns • Reverse the sort
Statistics Visualizer • One can find out more about the records in the dataset with the Statistics Visualizer Certain statistics are calculated, based on the number of records in the dataset. Depending on whether the type of data in the column is numeric or discrete, statistics are shown as box plots and histograms, respectively.
Statistics Visualizer Box Plots The box plots show Minimum Maximum Mean Median Two quartiles (25th and 75th percentiles) of numeric values in a column, as lines across a vertical colored bar The standard deviation of the dataset population is shown as a +/- value.
Histogram visualizer The histograms show results from columns of non-numeric data, such as string, or bin. The columns in the data table can contain strings such as “yes” or “spore_color,” or binned values such as “10-70.” There can be up to 100 distinct entries like the above. The default ordering of the string-valued (nominal) attributes is by decreasing count, but you can use the View pull down menu to choose an alternative sorting.
Scatter Visualizer The Scatter Visualizes individual datapoints correspond to rows in the data file. This visualization works well when the number of datapoints is less than 50,000, or when some processing has been performed so that the data is reduced to a small set of aggregates. The Scatter Visualizer produces scatter plots that can be animated to show relationships more clearly.
Scatter Visualizer The Scatter Visualizer displays a three-dimensional landscape with columns of data mapped to entities, and to elements such as the axes, size and color. If you map one or two numeric variables to the sliders, you can animate the size, color, or position of the entities.
Splat Visualizer With the Splat Visualizer you can visually analyze relationships among several variables . With some relationships seen even more clearly when you use the animation feature. The Splat Visualizer uses graphical objects, called splats, which represent aggregates of data points. The color and opacity, but not the position, of the splats can change during animation.
Tree Visulaizer The Tree Visualizer is a graphical interface that displays data as a three-dimensional landscape. Each level of the tree branches on the values of a different attribute. Each node in the tree shows a chart representing all the data in the subtree below it. The chart is composed of a base block with height and color depending on the data attributes. On each base are bars and/or disks whose number, label, height, and color are also determined by the attributes you have specified.
Map Visualizer The Map Visualizer helps you look at spatially related data. Besides dynamically navigating through this geographically based landscape, you can drill up and down to get an overview or to see increased granularity. Use animation to see how the data changes across one or two independent dimensions.
Functions Supported by Visualizers Animations • Automatic Slider Creation • Manual Slider Creation • Animation Trails No trails /Line trails/ Fade-out trails /Tube trails
Manipulating Scatter and Splat Visualizer Results Changing the Displays Panel, Set Background Color, Window Decoration, Animation Panel animation. Drilling Changing the Scatter Visualizer Display with the Shape Menu • Cube • Diamond • Sphere • Bar
Manipulating Scatter and Splat Visualizer Results Changing the Splat Visualizer Display with the Shape Menu Linear Gaussian Texture
HISTORY OF OPERATIONS VIEW This tab displays all the changes done to the dataset from the time of opening it. The operations done so far are shown in the form of a graph, which is present on the left part of the window. Clicking the node that represents the operation.
Scalability MineSet is optimized for the ultimate scalable performance on the Origin server. MineSet offers very large memory support (over 2GB) and data handling capability using the 64-bit implementation. NT platform. Parallelization and 64-bit support are offered on the highly scalable Silicon Graphics Origin servers.
IN CLOSING MineSet scores good in the foillowing: · Multi Data Access. · Multi Platform Ability. · Scalability. · Visualization. · Mining Tools. · Mining Algorithms. · Data Transformation Functions. · Data Manipulation in Displays. · It’s Simplicity as a whole. · I18N Support for Multibyte International Characters.
IN CLOSING Limitations Multi Source Integration. Density based Clustering. Mining Multimedia Databases. Mining text data. Mining the World Wide Web.
Source http://www.sgi.com/software/mineset/.