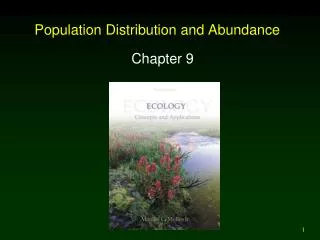
Chapter 2: Population
Chapter 2: Population. The Cultural Landscape: An Introduction to Human Geography. Critical Issues in Population Geography. More people are alive today than at any other time in human history

Chapter 2: Population
E N D
Presentation Transcript
Chapter 2: Population The Cultural Landscape: An Introduction to Human Geography
Critical Issues in Population Geography • More people are alive today than at any other time in human history • The world’s population increased at a faster rate during the second half of the twentieth century than every before. • Virtually all population growth today occurs in less developed countries (LDCs)
Case Study: India’s Population • Population: 1.2 billion • 1/3 under 15 years of age. • India is rapidly developing. • So, why is this problematic?
Chapter 2 Key Issue 1 Where Is the World’s Population Distributed?
Questions Geographers ask? • 1) Where is pop concentrated? • 2) Where is it growing? • 3) Why is it growing at different rates? • 4) Why geographers consider local diversity in growth rates to be important?
Where Is the World’s Population Distributed? • Two-thirds of the world’s population are in four regions: • East Asia • South Asia • Europe • Southeast Asia
Where Is the World’s Population Distributed? • Most of the worlds population : - 2/3 of population live within 500 km of an ocean. • Occupy: - Low lying areas w/ fertile soil & temperate climate.
East Asia • ¼ world population • China has 5/6 of East Asia population (clustered near Pacific coast) • Half of population is rural • Japan & Korea: 40% of population concentrated in Tokyo, Osaka, Seoul (less than 3% of total land area)
South Asia • ¼ world population (India, Pakistan, Bangladesh, and Sri Lanka) • Concentrated along a 900 mile stretch along the Indus & Ganga rivers (3/4 rural)
South East Asia • Third largest cluster (100 million on the island of Java) • Largely rural
Europe • Third largest cluster (1/9 of world population) • ¾ pop live in cities (highest concentration England, Belgium, Germany) • Food must be imported to sustain population
Population Distribution Figure 2-2
Sparsely populated regions • People generally avoid: • Dry lands 20% • Wet lands (equator) • Cold lands (poles) • High lands (mountainous)
Ecumene Portion of Earth’s surface occupied by permanent human settlement DG: intensive settlement LG: small-scale agriculture Y: hunting/ gathering W: uninhabited Figure 2-4
Where Is the World’s Population Distributed? • Population density • Arithmetic density • Physiological density • Agricultural density
Measures of Density Table 2-1
Where Has the World’s Population Increased Key Issue 2
Where Has the World’s Population Increased? • Natural increase rate (also includes migration) • The percentage by which a population grows in a year • Crude birth rate (CBR) • The number of births per 1,000 population • Crude death rate (CDR) • The number of deaths per 1,000 population • Natural increase rate (NIR) subtracting the number of deaths from live births.
World Population Growth Figure 2-8
Where Has the World’s Population Increased? • Fertility: # of children per woman/lifetime • Total fertility rate (TFR) • Mortality • Infant mortality rate (IMR) • Life expectancy
Figure 2-13 Figure 2-14 • Notice that places with high TFRs tend to have high IMRs and that places with low TFRs have low IMRs.
Key Issue III The Demographic Transition (a process with several stages)
Stage 1 (Low Growth) • Characterized by high crude birth/death rates. Why? • Depended on hunting & gathering NIR = roughly zero • 8000BC Agriculture Revolution = steady but low population +
Stage 2: High Growth • 1750: w.pop grew .5 million • 1800: w.pop grew to 5 million (why?) • Industrial Revolution in Europe & N.A. (Medical Revolution) diffuses East • CDR decreases (longer lives while CBR remain the same (high) • 1950: S2 hits rest of the world
Stage 3: Moderate Growth • More modest gap between CBR & CDR as the both CBR & CDR slows (Why?) • Economic changes • Europe/ NA reached 1st half of 20th century (delayed reaction • Asia/ LA = 2nd half • Africa = remains S2 • More likely to live urban
Stage 4: Low Growth • Zero population growth (ZPG) Reached when CBR = CDR (NIR = 0) • Total Fertility Rate (TFR factor) (Why?) • Women enter the labor force (less kids = smaller families) • Increased wealth = more expenses/ leisure • * note Western Countries increase pop due to immigrants mostly
Why Is Population Increasing at Different Rates? • Demographic transition • Four stages • Stage 1: Low growth • Agricultural revolution • Stage 2: High growth • Industrial Revolution • Stage 3: Moderate growth • Stage 4: Low growth • Zero population growth (ZPG)
Demographic Transition Figure 2-15
Key Issue III (2.0) Population Pyramid
Why Is Population Increasing at Different Rates? • Population pyramids • A bar graph showing a place’s age and sex composition • Shape of the pyramid is determined mainly by the CBR • Age distribution • Dependency ratio • Sex distribution • Sex ratio
Population Pyramids Figure 2-19
Why Is Population Increasing at Different Rates? • Countries are in different stages of the demographic transition • Three examples: • Cape Verde = High growth • Stage 2 since the 1950s • Chile = Moderate growth • Stage 3 since the 1960s • Denmark = Low growth • Stage 4 since the 1970s
Why Is Population Increasing at Different Rates? • Demographic transition & world population growth • Most countries = stage 2 or stage 3 of the Demographic Transition • Stages 2 and 3 are characterized by significant population growth • No country is in stage 1 of the demographic transition • It is easier to cause a drop in the CDR than in the CBR
Why Might Overpopulation be a Concern? • Malthus on overpopulation • An Essay on the Principle of Population (1798): Population grows geometrically while food supply grows arithmetically • Criticism of Malthus includes the following: • Pessimistic viewpoint • Failure to consider technological innovation • Marxist critique
Malthus: Theory & Reality Figure 2-25
Why Might Overpopulation be a Concern? • Declining birth rates • Reasons for declining birth rates • Reliance on economic development • Distribution of contraceptives • Reducing birth rates with contraception
Family Planning Figure 2-30
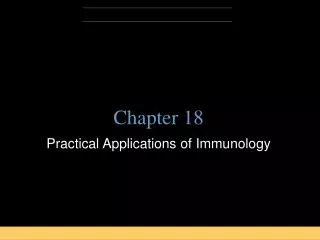
Why Might Overpopulation be a Concern? • World health threats • The epidemiologic transition • Stage 1: Pestilence and famine • The Black Plague • Pandemics
Why Might Overpopulation be a Concern? Figure 2-31 • World health threats • The epidemiologic transition • Stage 2: Receding pandemics • Cholera and Dr. John Snow
Why Might Overpopulation be a Concern? • World health threats • The epidemiologic transition • Stage 3: Degenerative diseases • Most significant: Heart disease and cancer • Stage 4: Delayed degenerative diseases • Medical advances prolong life
Why Might Overpopulation be a Concern? • World health threats • The epidemiologic transition • A possible stage 5: Reemergence of infectious diseases? • Three reasons why it might be happening: • Evolution • Poverty • Improved travel
The Most Lethal Infectious Disease: AIDS Figure 2-33
The End. Up next: Migration Figure 3-1