Download
1 / 19
190 likes | 319 Views
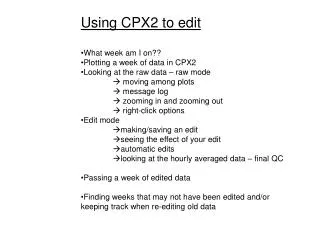
Using CPX2 to edit What week am I on?? Plotting a week of data in CPX2 Looking at the raw data – raw mode moving among plots message log zooming in and zooming out right-click options Edit mode making/saving an edit seeing the effect of your edit automatic edits

E N D
Using CPX2 to edit • What week am I on?? • Plotting a week of data in CPX2 • Looking at the raw data – raw mode • moving among plots • message log • zooming in and zooming out • right-click options • Edit mode • making/saving an edit • seeing the effect of your edit • automatic edits • looking at the hourly averaged data – final QC • Passing a week of edited data • Finding weeks that may not have been edited and/or keeping track when re-editing old data
You want these numbers to be close Last week edited with xshow Last week edited with cpx2 What week am I on?? Use the latest command at the command prompt: latest <enter> [aero:~/aer/thd/]$ latest Today is doy 131. Last record in h__cum file is... ALT,2010,131.75139 AMF,2010,131.75139 THD,2010,131.75139 This is week 19. Last week that passed QC is... h_e09w36.alt h_e09w45.amf h_e09w41.thd DB records... amf 2010-05-10T00:00:00Z: Week 18 thd 2010-05-10T00:00:00Z: Week 18
Plotting a week of data in CPX2 Typically editing is done on a weekly basis (Monday through Sunday) To extract a week of data you would use the following command line: cpx2 stn YYYYwWW 1w <enter> Where stn is the three letter station i.d. YYYY is the 4 digit year WW is the 2 digit week So to extract trinidad head (THD) week 19, 2010: cpx2 thd 2010w19 1w Notes: You don’t have to edit by week, but that’s how the editing is kept track of. You can be in any directory – don’t need to be in station directory. To extract/plot other time ranges using cpx2 see: http://www.esrl.noaa.gov/gmd/aero/software/aerosols/timeformat.html and Table 1 in cpx2 editing manual
Looking at the raw data – raw mode I typed: This command starts cpx2 with the desired data. cpx2 thd 2010w18 1w Buttons Replot, Back, Forward, History Pulldown menus Tabs (for different plots) Tab scroll buttons Loading bar Station, mode, activity
Moving among plots Prior to doing any editing, it is a good idea to look at all the plots, especially ‘housekeeping’ plots to be sure that all the instruments were working properly and that the flows, pressures, humidities, etc., were all within the expected range. The only place you can see the time series of housekeeping parameters is the raw data plots. • There are various options to move among plots: • Use your mouse and click on each plot tab. • Use the shortcut keys (‘n’ moves to next plot, ‘p’ moves to previous plot). • Use the right/left arrows – need to highlight one of the tabs for this to work. Note: more details about the shortcut keys can be found in both the cpx2 editing manual and under the help pulldown menu knowledge base hotkeys
Message log While you looking at the raw data, it can be useful to have the station message log up it may help explain some of the data behavior. The message log is under the pulldown menu CPX2 View message log
Zooming in and zooming out Use your mouse left-click button to select a region of interest (lines will appear). Click the replot button, or use the shortcut key ‘r’ to replot just that region. Replot key History button Back button • To zoom out – various options: • Back button • Use history button and select time range • Use shortcut key ‘a’ to go back to full range
Mouse issues Most of the time you will probably want to make vertical bars to zoom in on a specific time range (i.e., x-axis). Sometimes the mouse gets a little confused and makes boxes that zoom on both the x and y-axes. Here are some hints for optimizing data selection: Left-clickSelection box, may have vertical and horizontal constraints Shift+left-clickVertical selection bars only, no y-axis constraint Control+left-clickHorizontal selection bars only, no x-axis constraint <esc>Gets rid of selection constraint
Right-click options Sometimes you’ll want to do some simple changes to how a plot looks. If you right click on your mouse button you’ll get a menu that looks like this: • Manual zoom - lets you manually type in the desired x and y range • Set all tabs smoothing – lets you pick various types of smoothing to apply to data • The next line(s) (in this case N_N71 for the CN counter) - lets you remove a trace, change to symbols, get rid of the legend, or apply smoothing to that trace • All traces - lets you remove entire legend or smooth all traces • Indicators – toggles dilution and contamination flag indicators on/off • Grid – options to show an x, y or x&y grid • Show in pop up window – makes a separate plot window
Edit mode Use the display pulldown menu edit mode. Edit mode tabs have two plots for each measured parameter – top plot is raw, bottom plot has edits and corrections applied. Tabs (different plots than in raw mode) Tells you mode.
Making an edit • To make an edit you would follow these steps • Open the mentor edits window under the cpx2 menu. This will bring up a list of all edits for the time range plotted. • Zoom in on the data you wish to edit. • Click the ‘Add’ button on the mentor edits window. This will bring up the edit directive window ‘Add’ button
Making/saving an edit Edit time range – reflects whatever range is plotted, so if you’ve zoomed in time range will be zoomed range explain edit, for example: pump off Options -invalidate -contaminate -bit mask -poly fit Individual variables Grouped variables -absorption -counts -neph T,P,RH -scattering -scattering,absorption,counts Once you’ve filled out the box click OK The edit will be added to the mentor edits list
Saving an edit • You can continue adding edits by zooming in and out until you’ve built up a list. • When you are ready to see what the edited data look like click the ‘save’ button. This will save the edits. • Replot the data (use shortcut key ‘a’ or the history button or the replot button). cpx2 will apply the edits and in edit mode you can see the differences between raw and edited data on the two plots Save button • There’s an option to highlight an individual edit as well. Click on the edit in the mentor edits window so the edit is highlighted. The location of the edit will be highlighted on the plots as well.
Automatic edits Edit ‘remove’ button ‘auto’ button Use with caution! • Automatic edit button does two things (right now) • Looks for neph errors – (e.g., chopper errors) • Runs a complicated spike filter program which generates a lot of suggested edits. • Point 2 is why you would use this with caution – it will suggest a lot of edits that you will then need to go through and approve or remove. • Note: spike filter program is adjustible, but beyond scope of this overview!
Looking at averaged, edited data In edit mode, the last two plot tabs show the averaged, edited data. Looking at these plots is a good way to do final QC on your editing directives.
Passing a week of edited data • You’ve done all your editing and you are happy with how the edited data plots look. • Now it’s time to pass the data • To pass a week of data you would use the following command line: • data.pass --no-comment stn YYYYwWW <enter> • Where stn is the three letter station i.d. • YYYY is the 4 digit year • WW is the 2 digit week need to have both digits, so week 1 is ‘01’ • So to pass trinidad head (THD) week 19, 2010: • data.pass --no-comment thd 2010w19 • If you don’t include the tag ‘--no-comment’ you will get a window asking for some comments about the week of editing.
Finding weeks that may not have been edited • If you’ve been re-editing old data that has already been passed and, at the same time, still keeping up with editing new data, there is a way to keep track of where you are. It’s a two step procedure: • Run the script data.flagrepass.This script won’t remove data, but it will remove the database tag for a given time range that says the data have been passed. data.flagrepass stn start end where stn is the three letter station i.d. and start and end are the start and end times of the data that you will be re-editing. • Type at the command line: data.status stn <enter>. • For example, for station arn: • [aero:~]$ data.status arn • Loading stations ... Done • Data status for: ARN • =========================== Clean Data Gaps ========================== • 2009-04-20T00:00:00Z 2010-01-04T00:00:00Z (week 17, 37 weeks long) • 2010-03-01T00:00:00Z 2010-03-15T00:00:00Z (week 9, 2 weeks long) • ============================ Current Data ============================ • Latest raw data processed: 2010-05-12T18:03:00Z • Last clean data passed: 2010-03-29T00:00:00Z - Week 12 This shows you that there are some gaps in the record where data haven’t been passed.
Basic command line editing To start an editing session: cpx2 stn YYYYwWW 1w To pass data: data.pass --no-comment stn YYYYwWW Real examples: cpx2 thd 2010w18 1w data.pass --no-comment thd 2010w18 Everything else is pretty intuitive and/or similar to xshow… Happy editing!