Download
1 / 1
10 likes | 115 Views
Explore genetic diversity and relationships of Clemmys guttata populations in western New York to assess population health and impacts of a reintroduction program. Study conducted using microsatellite loci analysis. Results suggest low genetic diversity and significant population differentiation.

E N D
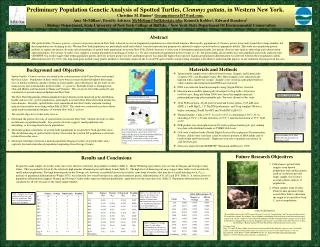
Background and Objectives • Spotted turtles, Clemmys guttata, are found in the eastern portion of the United States and around the Great Lakes. Populations of these turtles have been in steady decline throughout their range. Loss of habitat, pollution causing a decline in water quality, and collecting for the pet trade are the main reasons for recent declines in these turtles. C. guttata is Federally listed as endangered in Ohio and Illinois and threatened in Maine and Vermont. They are protected in Massachusetts and considered of special concern in Indiana and New York. • The New York Department of Environmental Conservation has been interested in the distribution, health, and size of C. guttata populations, particularly in western New York where their decline has been dramatic. Recently, spotted turtles were reintroduced into Erie County and radio tracking indicates these turtles were doing well in Fall of 2004. This study was conducted in order to better understand the population dynamics of western New York C. guttata. • The specific objectives of this study were to: • Determine the genetic diversity of spotted turtles in western New York. Genetic diversity is often an indicator of population health. Low genetic diversity suggests small population size, inbreeding, or low migration between populations. • Determine genetic relatedness of spotted turtle populations in western New York and other areas. The distribution map of spotted turtles (below) shows that the western NY population is relatively isolated from other areas. • Determine relatedness between a natural population (Niagara County) of spotted turtles and a captively bred and reintroduced population (originating from Oswego County). Spotted turtle distribution map (http://www.dec.state.ny.us/website/dfwmr/wildlife/endspec/sptufs.html). 10 bp ladder homozygote heterozygote 100 bp The New York State Reptile and Amphibian Atlas shows Spotted Turtle captures from 1990-1998 (http://www.dec.state.ny.us/website/dfwmr/wildlife/herp/turtles.html). Circles indicate the counties represented by spotted turtle samples in this study. Oswego County turtles were reintroduced into Erie County. Abstract The spotted turtle (Clemmys guttata), a species of special concern in New York, is known to exist in fragmented populations in eastern North America. Historically, populations of Clemmys guttata were easily found due to large numbers but these populations are declining in size. Western New York populations are particularly small and isolated. A recent reintroduction program was initiated to replace spotted turtles in appropriate habitat. This study uses population genetic methods to explore the genetic diversity and relationships of spotted turtle populations in western New York. Genetic diversity is often used to determine population health; low genetic diversity may indicate inbreeding and isolation from other populations. Two groups of turtles were sampled; a natural population from Niagara County (n = 10) and a reintroduced population in Erie County (n = 8). Ten polymorphic microsatellite loci were amplified and results analyzed with GENEPOP. Our results suggest that within population genetic diversity in these groups was low and homozygosity was generally higher than expected. Significant population differentiation was detected between these populations (allelic differentiation test, P < 0.05). Our long-term goals include using genetic methods to determine origins of the western NY spotted turtles and providing a baseline with which to understand the impacts of any reintroduction program in this area. Materials and Methods • Spotted turtle samples were collected from Oswego, Niagara, and Schenectady Counties (NY), and Franklin County (PA). Blood samples were taken from the hind leg with a small-bore syringe. Samples were stored in a phosphate buffered saline solution and refrigerated until DNA was extracted. • DNA was extracted from blood samples using Qiagen DNeasy tissue kit. • Nineteen microsatellite primer pairs developed for bog turtles (Glyptemys muhlenbergii; King and Julian 2004) were tested for amplification and polymorphism using polyacrylamide gels. Ten were chosen for this study. • 20 µl PCR reactions: 10 μM each forward and reverse primer,0.25 mM each dNTP, 1.5 mM MgCl2, 1 U Taq DNA polymerase, and 50 ng template DNA in a buffer containing 20 mM Tris-HCl and 50 mM KCl (pH 8.0). • Thermal regime: 2 min at 94°C; 34 cycles of 45 sec denaturing at 94°C, 45 sec annealing at 58°C, 1:30 min extension at 72°C; 5 min final extension at 72°C; hold at 4°C • PCR product was electrophoresed on 8% native polyacrylamide gels, post staining was done with ethidium bromide or SYBR® Gold soak. • Gels were visualized with a Kodak Digital Science Electrophoresis Documentation System. Alleles were sized and scored by relative position of DNA ladder and of bands within and between gels. Duplicates were run to maintain consistency of calls between gels. • Data were analyzed with GENEPOP® (Raymond and Rousset, 1995) Sampling a spotted turtle. Polyacrylamide gel of locus D121 showing genotypes of individual turtles. Future Research Objectives Results and Conclusions 1.Collect more spotted turtle samples from known populations and conduct genetic analysis on them to provide larger sample size for more accurate genetic analysis of populations. 2. Obtain samples from western Pennsylvania and more from eastern New York to determine the origin of western New York C. guttata populations. Despite the small sample size in this study, these sites showed a relatively large number of alleles (Table 1). Hardy Weinberg expectations were not met in Niagara and Oswego county turtles. This was partially driven by the relatively high number of homozygous individuals found (Table 2). The high level of homozygosity may suggest these turtles exist in relatively small, inbred populations.The high homozygosity in the Oswego site, however, is probably because these turtles came from a breeder, who may have a small breeding stock.FST, a measure of population differentiation (Wright 1978), was relatively low overall but three loci indicated moderate genetic differentiation (A19, A32 and D79; Table 3). A statistical test for population differentiation suggests Niagara and Oswego County turtles represent different populations, again driven by the same three loci (Table 3). Population differentiation was not calculated for all sites because of the small sample number. Table 2: FIS values for each locus by site. Positive FIS values indicate a higher number of homozygous individuals than expected. NA = no amplification. The final row is the probability of Hardy-Weinberg equilibrium. Table 1.Sample size (N) and number of alleles for each locus by population. Final row is average number of alleles over all 10 loci. ACKNOWLEDGEMENTS We would like to thank the USGS Leetown Science Center (Dr. Timothy King’s lab) for microsatellite markers. We would like to thank Travis Morse, Susan Standora, and Brandon Wojcikfor help in the field and laboratory. Schenectady County samples were provided by Karl Parker, NYDEC. Franklin County samples were provided by Tim Maret at Shippensburg University. Funding for this project was provided by the State University of New York College at Buffalo and the NY State Department of Environmental Conservation. Literature Cited King, T.L. and S.E. Julian (2004) Conservation of microsatellite DNA flanking sequence across 13 Emydid genera assayed with novel bog turtle (Glyptemys muhlenbergii) loci. Conservation Genetics 5: 719-725 Raymond, M. and F. Rousset (1995) GENEPOP Version 3.4. http://wbiomed.curtin.edu.au/genepop Wright, S. (1978) Evolution and the genetics of populations 4: Table 3: Niagara vs. Oswego County FST and allelic differentiation test Niagara vs. Oswego sites and all four sites. Locus names are after King and Julian, 2004.