Download
1 / 34
340 likes | 498 Views
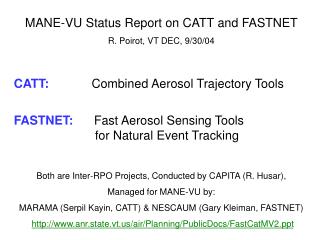
MANE-VU Status Report on CATT and FASTNET R. Poirot, VT DEC, 9/30/04 CATT: Combined Aerosol Trajectory Tools FASTNET: Fast Aerosol Sensing Tools for Natural Event Tracking Both are Inter-RPO Projects, Conducted by CAPITA (R. Husar),

E N D
MANE-VU Status Report on CATT and FASTNET R. Poirot, VT DEC, 9/30/04 CATT: Combined Aerosol Trajectory Tools FASTNET: Fast Aerosol Sensing Tools for Natural Event Tracking Both are Inter-RPO Projects, Conducted by CAPITA (R. Husar), Managed for MANE-VU by: MARAMA (Serpil Kayin, CATT) & NESCAUM (Gary Kleiman, FASTNET)
Within DATAFED.NET, CATT & FASTNET are 2 of many “Projects” which Share Many Common “Datasets” which can be Viewed, Compared, Archived, Exported, Analyzed & Interpreted, using a variety of Tools & Web-Based “Applications”
Data Catalog(s) Provide Access to Many: Fast (rapidly available), Current (near-real-time, recently archived & continuing) and Slow (historical data Like IMPROVE Aerosol & ATAD trajectories)
Data Catalogs: Aerosol, Fire, Maps, Meteorology, Emissions, Images, Events
Data Viewer: Open & View Any File in Catalog(s). Many Files Include Time Series, Linked to Map – Point & Click. Zoom Map or Time series, Change Size, Symbols, Variables, Add Layers, Export Data – Copy Paste.
Data Files Accessed & Archived Specifically for FASTNET. Note Varying Start dates (1988-2004), with Most Continuing. VIEWS_CHEM (IMPROVE Aerosol) and ATAD Trajectories (NPS) are currently used in CATT Applications
DataFed.net Large Collection of Projects, Data & Web Tools. Where’s “Start”? Kitty Start with Kitty:http://webapps.datafed.net/dvoy_services/datafed.aspx?view=Kitty
Kitty Change Species or Site Filtering & Data Export Acadia SO4 > 15 ug/m3 Change Sites by Point & Click
1. Start with Kitty to Explore Any Combinations of IMPROVE & ATAD Traj. Data (any/all sites & years). 2. Export CSV file of Selected Data & Copy/Paste into CSV Table Editor and Save for Subsequent Analysis.
1. Change Traj Sort. 2. Plot in Kitty 2. Export file as CSV data. 3. Copy/Paste into File Editor,Save. 4. Open YourFile in TrajAggGrid… Save(d) as: ALLpost99OCge10.csv
Select All Sites and Dates after 1/1/99 if : Organic Carbon >= 10 ug/m3. Fires in the West & Southeast (but not much in MANE-VU) Save CSV file & open in Trajectory Aggregator/Gridder, Weight Traj. by OC Concentration (or not), Normalize (or not) & Plot.
Na >= 1.5 ug/m3 Sea Salt Comes from the Sea, as She Should. BRIG & ACAD Battelle PMF/Unmix modeling indicated a Sea Salt source at 6 MANE-VU sites, Increasing over time. Why? Is West Coast Sea Salt Increasing?
Fine Soil >7.5, post-1999, All Sites & All Months Western & Asian Dust (Primarily Spring) Eastern Sahara Dust (Primarily Summer) Fine Soil > 7.5, All Years, All Sites, July-Only
South-Central California is large Source of High NO3 in West Eastern NO3 from both Eastern Agricultural & Urban areas All US Sites, Nitrate >= 7.5 ug/m3 Eastern US, Nitrate >= 7.5 ug/m3 Eastern US (minus DC), Nitrate >= 7.5 ug/m3 Western US, Nitrate >= 7.5 ug/m3
Arsenic Selenium Nickel Nickel Nickel
If SO4 > 15 for entire IMPROVE network and entire period of record (25 sites). Top 10% of “Secondary Sulfate Source” from Battelle PMF at ACAD, BRIG, GRSM, LYBR, MACA, SHEN & WASH (7 sites)
Areas upwind of High SO4 = areas of high SO2 emissions All US sites, SO4 >=15 Areas upwind of all sites for Highest dv = Highest SO4 1999 EGU SO2 Emissions from EPA Clean Air Markets, layered with NPS ATAD trajectories for high IMPROVE SO4 via DataFed Viewer... All US sites, dv >=30
CATT Percent Difference Tool Calculates Incremental Probabilities for any IMPROVE Site and Species and any Percentile Concentration Arsenic at Acadia http://webapps.datafed.net/dvoy_services/datafed.aspx?view=CATT_PERC_DIFF
Incremental Probabilities for Top 10% SO4 & NO3 at SHEN & WASH SO4 at SHEN SO4 at WASH NO3 at SHEN NO3 at WASH
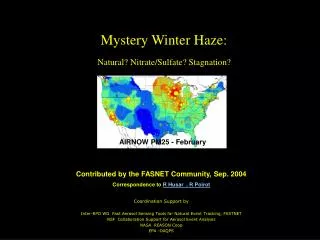
SURF_MET bext & “dry bext” (& other met) is global. 3873 sites for this hour, 1795 (circled) reporting bext. In “North American” domain below, there are 1870 sites with 1425 reporting visibility (blue). Red sites are 249 US-only, ASOS-only sites for which STI provides higher resolution bext, based on access to raw, uncensored data.
ASOS-STI “Dry Bext” vs. AIRNOW PM2.5 for NE NO3 & SW Dust on 2/19/04 Same as Above but using much denser SURF_MET ASOS gridded & contoured with AIRNOW PM2.5
Real-time Surface Meteorology provided a rich met context.Link to the Animation of the period Feb 19-21
FASTNET Aerosol Analyst Console(s): Snaps of Near-Real-Time Data Example: NE Sulfate Episode on 8/27/04 at 17:00 UTC (page 1 of 2)
FASTNET Aerosol Analyst Console, 8/27/04 at 17:00 UTC (page 2 of 2) Fires in the Southeast, Sahara Dust in the Gulf, Sulfate in the Northeast
Quebec Fires, July 6, 2002 SeaWiFS satellite and METAR surface haze shown in the Voyager distributed data browser Satellite data are fetched from NASA GSFC; surface data from NWS/CAPITA servers SeaWiFS, METAR & TOMS Index Superimposed
PM-2.5 vs. ASOS Bext during 7/02 Quebec Smoke Event. Note Ratio of scales = 6:1 implying 6 m2/g for Organics (which = 1.8 OC for this smoke)
Preliminary RAINS Hourly Sulfate data from 5 MANE-VU sites Note August 2nd Event (MD-only) vs. August 11th Event (All sites) From: Allen et al. 2004 (Draft – Do Not Cite)
8/2/04 13:00 Gridded ASOS Bext & AIRNOW PM-2.5 (Southern MANE-VU-only) 8/11/04 13:00 Gridded ASOS Bext & AIRNOW PM-2.5 (Entire MANE-VU Region)
Use Data Viewer to Layer Various Aerosol-Related Data, including: Surface Winds, (SURF-MET) ASOS Bext, (STI) PM-2.5 Mass, (AIRNOW) Forecast SO4 (Westphal)
RAINS Continuous Mass, SO4, OC data from Mohawk Mtn. CT vs. Bext from Bradley CT Airport - using MOMO species & Bradly RH to “Reconstruct” Bext. Prelim Data. Do Not Cite.
Some Bookmarks for: DataFed.Net: http://datafed.net/ Data Catalogs: http://webapps.datafed.net/dvoy_services/datafed_catalog.aspx Data Viewer:http://webapps.datafed.net/dvoy_services/datafed.aspx Data Consoles:http://www.datafed.net/consoles/realtime_consoles.asp?datetime=now-48&image_width=260&image_height=110 Kitty (Aerosol/Trajectory Browser): http://webapps.datafed.net/dvoy_services/datafed.aspx?view=Kitty CSV File Editor & Submitter: http://webapps.datafed.net/dvoy_services/editfile.aspx Trajectory Aggregator & Gridder (substitute: YourFileName.csv for ALLDVge30.csv) http://webapps.datafed.net/dvoy_services/datafed.aspx?view=TrajAggGrid&csv_url=ALLDVge30.csv&value_column=value&scale_max=0.005 CATT Percent Difference (Incremental Probability Calculator):http://webapps.datafed.net/dvoy_services/datafed.aspx?view=CATT_PERC_DIFF CATT & FASTNET Discussion Pages: http://webapps.datafed.net/dvoy_services/dvoy_book.aspx?path=HOME/Projects/CATT http://webapps.datafed.net/dvoy_services/dvoy_book.aspx?path=HOME/Projects/FASTNET