Download
1 / 1
10 likes | 115 Views
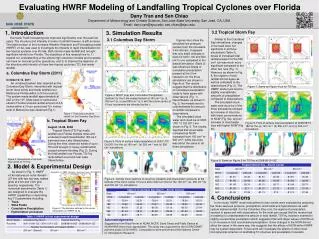
This research evaluates HWRF model's performance in predicting tropical cyclones making landfall in Florida, focusing on structure, intensity, rainfall, and track accuracy. The study highlights improvements needed in rainfall depiction and forecasting, despite notable advancements in hurricane track predictions. The analysis includes simulations for the Columbus Day Storm in 2011 and Tropical Storm Fay in 2008, showcasing the model's strengths and weaknesses in capturing key tropical cyclone parameters. The findings aim to enhance understanding of high-resolution models' impact on tropical cyclone operations and improve forecast accuracy.

E N D
Evaluating HWRF Modeling of Landfalling Tropical Cyclones over Florida Dany Tran and Sen Chiao Department of Meteorology and Climate Science, San José State University, San José, CA, USA Email: dany.tran@sjsu.edu; sen.chiao@sjsu.edu 1. Introduction 3. Simulation Results 3.2 Tropical Storm Fay Similar to the Columbus Day simulations, changes in the track were not significant in all three simulations (Table 3). Areas of increased total rainfall present for the 500 cm-3 run was much more significant compared to the other two runs (Fig. 7). However, as shown in Fig. 8, the regions of total rainfall did not agree as well as compared to the observations (Fig. 2). The HWRF model runs tend to slightly overestimate amounts of precipitation compared to observations. The simulated cloud water and cloud ice of the three simulations showed an increase of cloud ice with lower concentrations of NCW (Fig. 9a), and an increase of cloud water tops with higher NCW (Fig 9c). Hurricane Track forecasting has improved significantly over the past few years. The structure and intensity in terms of rainfall however, is still an issue. The latest version of the Hurricane Weather Research and Forecasting model (HWRF) v3.4a, was used to investigate the impacts of rapid intensification for two tropical systems over Florida. Both storms made landfall and brought significant rainfall over Florida. The objectives of this research are to: 1) expand our understanding of the effects high resolution models and forecasts can have on tropical cyclone operations, and 2) to improve the depiction of the structure and intensity of these two tropical cyclones (TC) that made landfall. 3.1 Columbus Day Storm a b c Figures 4a-c show the simulated low pressure centers from the moveable 3 km domain. It appears that only slight changes in track for both (100 and 500 cm-3) runs compared to the default simulation (Table 2) was observed. Areas of cumulative precipitation present at the 3 km resolution for the three simulations are shown in Figs.4c-d. The results suggest that the distribution of cumulative precipitation tends to fairly agree with observations (Fig. 1). Nevertheless, as shown in Fig. 5, the models tend to underestimate the amount of rainfall compared to observations. The simulated cloud water and cloud ice at 0000 UTC 10 Oct 2011 are shown in Fig. 6. The results depicted that cloud water increased as NCW increased from 100 cm-3 to 500 cm-3, while cloud ice was about the same in all three simulations. a b c f d e d e f a. Columbus Day Storm (2011) • October 6-13, 2011 • An unnamed system later deemed as the Columbus Day Storm, intensified with tropical storm force winds and made landfall over Melbourne Florida within a 24 hour period. The system made landfall approximately at 00Z on the 10th. Most parts of central and eastern Florida received rainfall amount of 4-8 inches within a 3 hour period and 10+ inches west of Melbourne was observed (Fig.1). Figure 7. Same as Figure 4 but for TS Fay. c a b Figure 4. MSLP (top) and Cumulative Precipitation (bottom) for the 3 km nested domain at 100 cm-3 (a, d), 250 cm-3 (b, e) and 500 cm-3 (c, f) with the storm center at 6 hour increments are denoted by the +. c a b Figure 1. Track and cumulative rainfall for the Columbus Day Storm. b. Tropical Storm Fay Figure 8. Plots of surface total precipitation at 2008/08/19 18Z for the (a) 100 cm-3, (b) 250 cm-3, and (c) 500 cm-3 simulations. • August 14-28, 2008 • Tropical Storm (TS) Fay made landfall over Florida multiple times and underwent rapid intensification (RI) as it traversed over Lake Okeechobee. During this time, observed winds of up to 75 knots brought in heavy rainfall which caused extreme flooding (Fig. 2). During the first landfall over Florida, TS Fay reintensified over land near Lake Okeechobee. b c a Figure 5. Plots of surface total precipitation at 0000 UTC Oct 2011 for the (a) 100 cm-3, (b) 250 cm-3, and (c) 500 cm-3 simulations. c a b Figure 2. Observations of the track total rainfall for TS Fay. Figure 9. Same as Figure 5 for TS Fay at 2008/08/19 18Z. 2. Model & Experimental Design • As shown in Fig. 3, HWRF v3.4a features an outer domain (27 km) with two two-way nested grids at 9 km and 3 km grid spacing, respectively. The numerical experiments (Table 1) are designed to evaluate the HWRF capabilities in describing key TC parameters including: • Track • Wind Fields • Cumulative Precipitation • Hydrometeor processes Figure 6. Vertical cross sections of cloud ice (shaded) and cloud water (contours) at the latitude of the storm center 12 hours after initial run time for the 100 cm-3 (a), 250 cm-3 (b) and 500 cm-3 (c) simulations. 4. Conclusions In this study, HWRF model simulations for two events were evaluated by analyzing the mean sea level pressure, precipitation, wind fields and hydrometeors as each system makes landfall. For the Columbus Day runs, the regions of precipitation seemed to agree well with observations for the most part except that the models had a tendency to underestimate the amount of total rainfall. TS Fay, however, seemed to slightly overestimate precipitation which suggested that with larger values of NCW led to an increase in total accumulated precipitation. Since changes in the NCW did not affect the cases in the same way, this suggests that the affects of NCW within HWRF may be system dependent. Future work will investigate the effects of other cloud microphysical schemes on landfalling TC structure and precipitation forecasts. Figure 3. The domains defined in the vortex initialization for HWRF v3.4a Acknowledgements Suggestions from Brad Ferrier at NOAA./NCEP, David Sharp and Pablo Santos at NOAA/NWS were much appreciated. This study was supported by the UCAR/COMET partners project (Z12-91850). Computations were performed at the National Center for Atmospheric Research.