CABLE-STAYED BRIDGE SEISMIC ANALYSIS USING ARTIFICIAL ACCELEROGRAMS Roman Guzeev, Ph.D.
300 likes | 528 Views
CABLE-STAYED BRIDGE SEISMIC ANALYSIS USING ARTIFICIAL ACCELEROGRAMS Roman Guzeev, Ph.D. Institute Giprostroymost-Saint-Petersburg Russian Federation http: // www.gpsm.ru. 1. The Eastern Bosporus bridge, Vladivostok, Russia. 2. Presentation of the Response spectrum in national codes. 3.

CABLE-STAYED BRIDGE SEISMIC ANALYSIS USING ARTIFICIAL ACCELEROGRAMS Roman Guzeev, Ph.D.
E N D
Presentation Transcript
CABLE-STAYED BRIDGE SEISMIC ANALYSIS USING ARTIFICIAL ACCELEROGRAMS Roman Guzeev, Ph.D. Institute Giprostroymost-Saint-Petersburg Russian Federation http://www.gpsm.ru
1 The Eastern Bosporus bridge, Vladivostok, Russia
2 Presentation of the Response spectrum in national codes
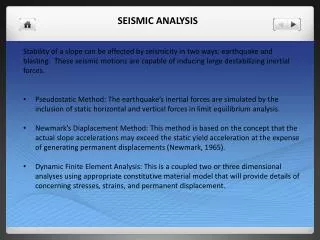
3 Disadvantages of the Response Spectrum Method • it is inapplicable for structures with anti-seismic devices, which make behavior of the structures nonlinear • It does not take into account seismic wave propagation • It considers mode shape vibration as statistically independent • It uses approximate relations between response spectrum curves with different damping.
4 Time history analysis using accelerograms. Instrumentally recorded ground acceleration. 1994, Northridge, Santa Monica, City Hall Grounds 1940, El Centro Site
5 Instrumentally recorded ground acceleration ? • The main features • Instrumentally recorded earthquake acceleration is an event of random process • Every earthquake is unique and has its own peak acceleration and spectral distribution • Any earthquake Depends on ground condition • Instrumentally recorded acceleration can be dangerous to one type of structure and can be safe to another
6 Artificial accelerograms • Artificial accelerogram should meet requirements of national codes: • There should be a peak value on accelerogram. The peak value depends on the region seismic activity, ground condition and period of exceedance. • 2. Accelerogram response spectrum should match design spectrum
7 Artificial accelerograms • Artificial accelerogram should meet physical requirements: • Acceleration, velocity and displacement should be equal to zero at the beginning and at the end of the earthquake • 2. Duration of the earthquake should not be less than 10 sec.
8 • sought coefficients, • natural period of mode i, • number of considered modes The accelerogram generation algorithm Step 1. Generating accelerogram with peak value equal to 1 Step 2. Scaling accelerogram according to the design value of ground acceleration. The accelerogram to be found is presented as trigonometric series: We take into account the modes which contribute to effective modal mass in the earthquake direction
9 The accelerogram constraints Peak value nonlinear constraint: Acceleration, velocity and displacement linear constraints:
10 Generated accelerogram response spectrum Where, is the solution of differential equation of motion for one DOF oscillator on sine and cosine base excitation. - damping ratio of design response spectrum
11 The coefficient of series terms to be found сan be determined by means of the least square method with linear and nonlinear constraints We minimize the sum square of differences between accelerogram response spectrum and the design response spectrum F –object sum square function [W] – diagonal matrix of weight factors – vector of differences between the accelerogram response spectrum and the design response spectrum
12 • Recommendation on analysis using artificial acelerogram • Terms of series should contain natural frequencies of structures. It lead to resonance excitation. • We should take into account the modes which contribute to effective modal mass in the earthquake direction • For the closest match to design response spectrum we can add extra terms into the series • We have to generate more than one design accelerogram. We can do it by varying the number of terms and considered modes • For every strain-stress state parameter we have to built an envelope caused by action generated accelerograms
13 Golden Horn Bay cable-stayed bridge, Vladivostok, Russia Concrete deck Steel deck
14 Seismic action input data Elastic response spectrum - design spectrum - elastic spectrum - ductility factor - elastic spectrum Peak ground acceleration with 0.08 damping ratio Return period is 5000 years. - dumping correction factor - modal damping ratio
15 GTSTRUDL Model
18 Stiffness weighted average damping CONSTANT MODAL DAMPING PROPORTIONAL TO STIFFNESS 0.025 GROUP 'PYLON' MODAL DAMPING PROPORTIONAL TO STIFFNESS 0.02 GROUP 'DECK' MODAL DAMPING PROPORTIONAL TO STIFFNESS 0.05 GROUP 'SUPP' MODAL DAMPING PROPORTIONAL TO STIFFNESS 0.00096 GROUP 'CABLE' DYNAMIC PARAMETERS RESPONSE DAMPING STIFFNESS 1.0 END OF DYNAMIC PARAMETERS COMPUTE MODAL DAMPING RATIOS AVERAGE
19 Accelerogram generation results
20 Response spectrum analysis. GTSTRUDL statement. STORE RESPONSE SPECTRA ACCELERATION LINEAR vs - NATURAL PERIOD LINEAR 'SEYSM‘ DAMPING RATIO 0.02 FACTOR 0.26242 ………………………………………………………………………………………… ………………………………………………………………………………………… END OF RESPONSE SPECTRA RESPONSE SPECTRA LOADING 'RSP' 'response' SUPPORT ACCELERATION TRANS X FILE 'SEYSM' END RESPONSE SPECTRUM LOAD LOAD LIST 'RSP' ACTIVE MODES ALL PERFORM MODE SUPERPOSITION ANALYSIS COMPUTE RESPONSE SPECTRA FORCES MODAL COMBINATION RMS MEM ALLCOMPUTE RESPONSE SPECTRA DISPL MODAL COMBINATION RMS JOINTS ALL
21 Time history analysis. GTSTRUDL statement. STORE TIME HISTORY ACCELERATION TRANSLATION – 'EARTHQ' FACTOR 0.26231 0.0000000 0.0000000 -0.0441006 0.0100000 -0.0805970 0.0200000 ………………………………………………………………………………………… ………………………………………………………………………………………… TRANSIENT LOADING 1 SUPPORT ACCELERATION TRANSLATION X FILE 'EARTHQ' INTEGRATION FROM 0.0 TO 25.0 AT 0.01 ACTIVE MODES ALL DYNAMIC ANALYSIS MODAL STORE TIME HISTORY ACCELERATION TRANSLATION – 'EARTHQ' FACTOR 0.26231 0.0000000 0.0000000 -0.0441006 0.0100000 -0.0805970 0.0200000 ………………………………………………………………………………………… ………………………………………………………………………………………… TRANSIENT LOADING 1 SUPPORT ACCELERATION TRANSLATION X FILE 'EARTHQ' INTEGRATION FROM 0.0 TO 25.0 AT 0.01 ACTIVE MODES ALL DYNAMIC ANALYSIS MODAL
22 The time history analysis results
23 Time history analysis record
24 The Result comparison
25 Conclusion • Time history analysis using artificial accelerograms overcome weaknesses of the response spectrum method: • this analysis is applicable for structures with anti-seismic devices, which make behavior of the structures nonlinear; • this analysis can take into account seismic wave propagation; • this analysis does not consider mode shape vibration as statistically independent; • this analysis uses exact methods of taking into account structural damping. • 2. Time history analysis using artificial acelerograms does not contradict with national codes. • 3. Time history analysis using artificial acelerograms usually gives higher value of forces and displacements.