Download
1 / 64
650 likes | 722 Views
Learn about firms' objectives, costs, and profits in economics. Explore production functions, marginal product, and cost curves. Understand the difference between economic profit and accounting profit.

E N D
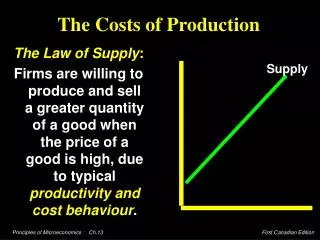
The Costs of Production • The Law of Supply ä Firms are willing to produce and sell a greater quantity of a good when the price of the good is high. ä This results in a supply curve that slopes upward.
The Firm’s Objective • The economic goal of the firm is to maximize profits.
A Firm’s Total Revenue and Total Cost • Total Revenue äThe amount that the firm receives for the sale of its product. • Total Cost ä The amount that the firm pays to buy inputs.
A Firm’s Profit • Profit is often referred to as producer surplus. • It is the amount a seller is paid minus costs. Profit = Total revenue - Total cost
Costs as Opportunity Costs • A firm’s costs of production include all the opportunity costs of making its output of goods and services.
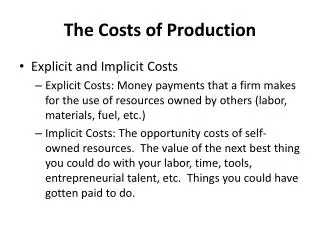
Explicit and Implicit Costs • A firm’s cost of production include explicit costs and implicit costs. äExplicit costs involve a direct money outlay for factors of production. äImplicit costs do not involve a direct money outlay.
Economic Profit versus Accounting Profit • Economists include allopportunity costs when measuring costs. • Accountants measure the explicit costs but often ignore the implicit costs.
Economic Profit versus Accounting Profit • When total revenue exceeds both explicit and implicit costs, the firm earns economicprofit. ä Economic profit is smaller than accounting profit.
How an Economist Views a Firm Economic profit Implicit costs Total opportunity costs Explicit costs Economic Profit versus Accounting Profit Revenue
How an Economist How an Accountant Views a Firm Views a Firm Economic profit Accounting profit Implicit costs Revenue Total opportunity costs Explicit Explicit costs costs Economic Profit versus Accounting Profit Revenue
Production and Costs • A firm’s costs reflect its production process.
The Production Function • The production function shows the relationship between quantity of inputs used to make a good and the quantity of output of that good.
Marginal Product • The marginal product of any input into production is the increase in the quantity of output obtained from an additional unit of that input.
Marginal Product • The marginal product of any input into production is the increase in the quantity of output obtained from an additional unit of that input.
Diminishing Marginal Product • Diminishing marginal product is the property whereby the marginal product of an input declines as the quantity of the input increases. • Example: As more and more workers are hired at a firm, each additional worker contributes less and less to production because the firm has a limited amount of equipment.
Diminishing Marginal Product • The slope of the production function measures the marginal product of an input, such as a worker. • When the marginal product declines, the production function becomes flatter.
Quantity of Output (cookies per hour) 150 Production function 140 130 120 110 100 90 80 70 60 50 40 30 20 10 0 1 2 3 4 5 Number of Workers Hired A Production Function
Hit and Run If you see this car, please tell someone!
Production Function and Total Costs • The relationship between the quantity a firm can produce and its costs determines its pricing decisions. • The total-cost curve shows this relationship graphically.
A Production Function and Total Cost Marginal Number of Output Cost of Cost of Total Cost Product of Workers (Quantity) Factory Workers of Inputs Labor 0 0 $30 $0 $30 1 50 50 30 10 40 2 90 40 30 20 50 3 120 30 30 30 60 4 140 20 30 40 70 5 150 10 30 50 80
Total-Cost Curve Total Cost $80 Total-cost curve 70 60 50 40 30 20 10 0 20 40 60 80 100 120 140 Quantity of Output (cookies per hour)
The Various Measures of Cost • Costs of production may be divided into fixed costs and variable costs. • Fixed costs are those costs that do not vary with the quantity of output produced. • Variable costs are those costs that do vary with the quantity of output produced.
Family of Total Costs • Total Fixed Costs (TFC) • Total Variable Costs (TVC) • Total Costs (TC) TC = TFC + TVC
Average Costs • Average costs can be determined by dividing the firm’s costs by the quantity of output produced. • The average cost is the typical cost of each unit of product.
Family of Average Costs • Average Fixed Costs (AFC) • Average Variable Costs (AVC) • Average Total Costs (ATC)
Marginal Cost • Marginal cost (MC) measures the increase in total cost that arises from an extra unit of production. • Marginal cost helps answer the following question: ä How much does it cost to produce an additional unit of output?
Quantity of Output (bagels per hour) Cost Curves and Their Shapes Costs $3.00 2.75 2.50 2.25 2.00 1.75 1.50 1.25 1.00 0.75 0.50 0.25 0 1 2 3 4 5 6 7 8 9 10 11 12 13 14
Quantity of Output (bagels per hour) Cost Curves and Their Shapes Costs $3.00 2.75 2.50 2.25 MC 2.00 1.75 1.50 1.25 1.00 0.75 0.50 0.25 0 1 2 3 4 5 6 7 8 9 10 11 12 13 14
Cost Curves and Their Shapes • Marginal cost rises with the amount of output produced. ä At low levels of output, an increase in production will occur at a relatively small cost. ä Increasing output is more costly when the amount being produced is already high.
Quantity of Output (bagels per hour) Cost Curves and Their Shapes Costs $3.00 2.75 2.50 2.25 2.00 1.75 1.50 1.25 1.00 0.75 0.50 0.25 0 1 2 3 4 5 6 7 8 9 10 11 12 13 14
Quantity of Output (bagels per hour) Cost Curves and Their Shapes Costs $3.00 2.75 2.50 2.25 2.00 1.75 1.50 ATC 1.25 AVC 1.00 0.75 0.50 0.25 AFC 0 1 2 3 4 5 6 7 8 9 10 11 12 13 14
Cost Curves and Their Shapes • The ATC curve is U-shaped. äAt very low levels of output ATC is high because fixed cost is spread over only a few units. äATC declines as output increases. äATC starts rising because average variable cost rises substantially.
Relationship Between MC and ATC • Whenever marginal cost is less than average total cost, average total cost is falling. • Whenever marginal cost is greater than average total cost, average total cost is rising.
Relationship Between MC and ATC • The marginal-cost curve crosses the average-total-cost curve at the efficient scale. ä Efficient scale is the quantity that minimizes average total cost.
Quantity of Output (bagels per hour) Relationship Between Marginal Cost and Average Total Cost Costs $3.00 2.75 2.50 2.25 2.00 1.75 1.50 1.25 1.00 0.75 0.50 0.25 0 1 2 3 4 5 6 7 8 9 10 11 12 13 14
Quantity of Output (bagels per hour) Relationship Between Marginal Cost and Average Total Cost Costs $3.00 2.75 2.50 2.25 2.00 1.75 1.50 ATC 1.25 1.00 0.75 0.50 0.25 0 1 2 3 4 5 6 7 8 9 10 11 12 13 14
Quantity of Output (bagels per hour) Relationship Between Marginal Cost and Average Total Cost Costs $3.00 2.75 2.50 2.25 MC 2.00 1.75 1.50 ATC 1.25 1.00 0.75 0.50 0.25 0 1 2 3 4 5 6 7 8 9 10 11 12 13 14
Helpful Reminders • Marginal vs Average • GPA example • Ask yourself why MC and AVC decreasing at first Top Three Things to Remember • MC eventually rises with the Q of output • The ATC curve is U-shaped • The MC crosses ATC at the min of ATC
Costs in the Long Run • For many firms, the division of total costs between fixed and variable costs depends on the time horizon being considered. ä In the short run some costs are fixed. ä In the long run fixed costs become variable costs.
Costs in the Long Run • Because many costs are fixed in the short run but variable in the long run, a firm’s long-run cost curves differ from its short-run cost curves.
U-Shaped Long-Run Average Total Cost Average Total Cost 0 Quantity of Cars per Day
U-Shaped Long-Run Average Total Cost Average Total ATC in short run with small factory Cost 0 Quantity of Cars per Day
U-Shaped Long-Run Average Total Cost Average Total ATC in short run with medium factory ATC in short run with small factory Cost 0 Quantity of Cars per Day
U-Shaped Long-Run Average Total Cost Average Total ATC in short run with medium factory ATC in short run with large factory ATC in short run with small factory Cost 0 Quantity of Cars per Day