Download
1 / 49
490 likes | 514 Views
Learn about the structure and functions of the electric power industry, key organizations, regional entities, regulatory bodies, and the role of control centers. Explore the evolution and current landscape of the industry.

E N D
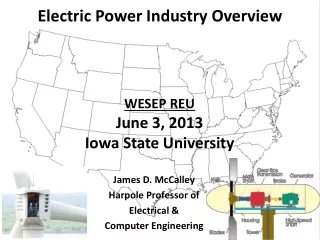
WESEP REUJune 3, 2013Iowa State University Electric Power Industry Overview James D. McCalley Harpole Professor of Electrical & Computer Engineering
Outline The electric power industry Control centers Electricity markets 2
Organizations comprising the Electric Power Industry • Investor-owned utilities: 239 (MEC, Alliant, Xcel, Exelon, …) • Federally-owned: 10 (TVA, BPA, WAPA, SEPA, APA, SWPA…) • Public-owned: 2009 (Ames, Cedar Falls, Muscatine, …) • Consumer-owned: 912 (Dairyland, CIPCO, Corn Belt, …) • Non-utility power producers: 1934(Alcoa, DuPont,…) • Power marketers: 400 (e.g., Cinergy, Mirant, Illinova, Shell Energy, PECO-Power Team, Williams Energy,…) • Coordination organizations: 9 (ISO-NE, NYISO, PJM, MISO, SPP, ERCOT, CAISO, AESO, NBSO), 7 are in the US. • Oversight organizations: • Regulatory: 52 state, 1 Fed (FERC) • Reliability: 1 National (NERC), 8 regional entities • Environment: 52 state (DNR), 1 Fed (EPA) • Manufacturers: GE, ABB, Toshiba, Schweitzer, Westinghouse,… • Consultants: Black&Veatch, Burns&McDonnell, HD Electric,… • Vendors: Siemens, Areva, OSI,… • Govt agencies: DOE, National Labs,… • Professional organizations: IEEE PES … • Advocacy organizations:AEWA, IWEA, Wind on Wires… • Trade Associations: EEI, EPSA, NAESCO, NRECA, APPA, PMA,… • Law-making bodies: 52 state legislatures, US Congress 3
Transmission and System Operator G G G G G G G G G G G G Independent System Operator G Transmission Operator Transmission Operator Transmission Operator G Today G G Independent System Operator Vertically Integrated Utility 1900-1996/2000 5
What are the North American Interconnections? “Synchronized” 6
What is NERC? • NERC: The North American Reliability Corporation, certified by federal government (FERC) as the “electric reliability organization” for the United States. • Overriding responsibility is to maintain North American bulk transmission/generation reliability. Specific functions include maintaining standards, monitoring compliance and enforcing penalties, performing reliability assessments, performing event analysis, facilitating real-time situational awareness, ensuring infrastructure security, trains/certifies system operators. • There are eight NERC regional councils (see below map) who share NERC’s mission for their respective geographies within North America through formally delegated enforcement authority • Western Electricity Coordinating Council (WECC) • Midwest Reliability Organization (MRO) • Southwest Power Pool (SPP) • Texas Reliability Entity (TRE) • Reliability First Corporation (RFC) • Southeast Electric Reliability Council (SERC) • Florida Reliability Coordinating Council (FRCC) • Northeast Power Coordinating Council (NPCC) 7
What is FERC? • An independent agency that regulates the interstate transmission of electricity, natural gas, and oil. It does the following: • Regulates transmission & wholesale sales of electricity in interstate commerce; • Regulates all wholesale natural gas transmission; • Reviews mergers/acquisitions /corporate transactions by electricity companies; • Can review some siting applications for electric transmission projects; • Licenses and inspects private, municipal, and state hydroelectric projects; • Protects the reliability of the high voltage interstate transmission system through mandatory reliability standards; • Monitors and investigates energy markets; • Enforces FERC regulatory requirements via civil penalties/other means; • Oversees environmental matters related to natural gas/hydroelectric projects; • Administers accounting/financial reporting regs+conduct of regulated companies • FERC does not: • Regulate retail electricity and natural gas sales to consumers; • Regulate activities of municipals or federal power marketing agencies; • Regulate nuclear power plants (NRC does this); • Address reliability problems related to failures of local distribution facilities; • Consider tree trimmings near local distribution power lines in residential neighborhoods 8
Regional Transmission Organizations/Independent System Operators • The regional system operator: monitors and controls grid in real-time • The regional market operator: monitors and controls the electricity markets • The regional planner: coordinates 5 and 10 year planning efforts • They own no electric power equipment. • None of them existed before 1996. • They are central to electricity production and transmission today. 9
Energy Control Centers • Energy Control Center (ECC): • SCADA, EMS, operational personnel • “Heart” (eyes & hands, brains) of the power system • Supervisory control & data acquisition (SCADA): • Supervisory control: remote control of field devices, including gen • Data acquisition: monitoring of field conditions • SCADA components: • Master Station: System “Nerve Center” located in ECC • Remote terminal units: Gathers data at substations; sends to Master Station • Communications: Links Master Station with Field Devices, telemetry is done by either leased wire, PLC, microwave, or fiber optics. • Energy management system (EMS) • Topology processor & network configurator • State estimator and power flow model development • Automatic generation control (AGC), Optimal power flow (OPF) • Security assessment and alarm processing 10
ECCs: EMS & SCADA Remote terminal unit Substation SCADA Master Station Communication link Energy control center with EMS EMS alarm display EMS 1-line diagram 12
ECCs: SCADA, Telemetry, EMS, RT, DA Markets EMS Day-ahead market Real-time market Automatic Generation Control (AGC) is a feedback control system that regulates the power output of electric generators to maintain a specified system frequency and/or scheduled interchange. Intra-day & day-ahead reliability unit commitment (RAC) 13
Balancing authorities Performs AGC within designated area. 105 BAs in N. Am.: 67 in EI, 38 in WI, 1 in Texas. Every ISO is a BA. Not every BA is an ISO. 14
Basic market design used by all ISOs today. Schedules entire “next-day” 24hr period. Schedules interchange for entire “next-day” 24hr period, starting at current hour, optimizing one hour at a time (1 value per hr) Computes dispatch every 5 minutes. 15
Balancing Systems ENERGY BUY BIDS DAY-AHEAD MARKET 1 sol/day gives 24 oprtingcdtns min ΣΣ zit{Cost(GENit)+Cost(RSRVit)} sbjct to ntwrk+statuscnstraints ENERGY & RESERVE SELL OFFERS REQUIRED RESERVES LARGE MIXED INTEGER PROGRAM BOTH CO-OPTIMIZE: energy & reserves ENERGY BUY BIDS REAL-TIME MARKET 1 sol/5min gives 1 oprtngcdtn min ΣΣ {Cost(GENit)+Cost(RSRVit)} sbjct to ntwrkcnstraints ENERGY & RESERVE SELL OFFERS REQUIRED RESERVES LARGE LINEAR PROGRAM NETWORK AUTOMATIC GENERATION CONTROL SYSTEM FREQUENCY DEVIATION FROM 60 HZ 16
Basics of electricity markets • Locational marginal prices (LMPs), $/MWhr, indicate the energy price at each bus. • Markets compute LMPs via an internet-based double auction that maximizes participant benefits. The LMPs are computed from SCED every hour in the DAM and every 5 minutes in the RTM. • The DAM and the RTM are 2 separate settlement processes. 17
Internet-based two-sided auction markets Internet System B1 S1 B2 S2 B3 • Buyers submit bids to buy in terms of • Price ($/MWhr) • Quantity (MWhr) • Sellers submit offers to sell in terms of • Price ($/MWhr) • Quantity (MWhr) Price at which seller is willing to sell increases with amount (cost of producing 1 more energy unit increases as a gen is loaded higher) Price at which buyer is willing to buy decreases with amount (first unit is used to supply most critical needs and after those needs are satisfied, next units of energy are used to satisfy less critical needs) This table orders offers and bids for each agent. 18
Internet-based two-sided auction markets This table orders offers and bids for each agent (same as previous slide) This table orders offers and bids across all selling and buying agents, respectively. 19
Market clearing price L. Tesfatsion, “Auction Basics for Wholesale Power Markets: Objectives and Pricing Rules,” Proceedings of the 2009 IEEE Power and Energy Society General Meeting, July, 2009. Computed as the price where the supply schedule intersects the demand schedule. SUPPLY Price ($/MWhr) DEMAND Quantity (MWhr) 20
Market clearing price L. Tesfatsion, “Auction Basics for Wholesale Power Markets: Objectives and Pricing Rules,” Proceedings of the 2009 IEEE Power and Energy Society General Meeting, July, 2009. Computed as the price where the supply schedule intersects the demand schedule. SUPPLY Price ($/MWhr) DEMAND Quantity (MWhr) 21
Subject to 1. SCED obj fnct also includes regulation term, separating reg-up from reg-down. Security-constrained economic dispatch (SCED) 2. “Value” terms in obj fnct can be set by stepped curves established by ISO. Max demand Σ di+wi<DMAXi for all i (9) • We allow offers and bids to be made on energy and reserves. • This problem is solved for a single operating condition. • The operating condition is representative for • a certain time period (either 1 hour or 5 minutes). The above is a simplified version. The MISO Business Practice Manual BPM-002-r11, Chapter 6, provides a detailed description of the SCED. See https://www.midwestiso.org/Library/BusinessPracticesManuals/Pages/BusinessPracticesManuals.aspx.
Subject to 1. SCUC obj fnct also includes regulation term, separating reg-up from reg-down. Security-constrained unit commitment (SCUC) 2. “Value” terms in obj fnct can be set by stepped curves established by ISO. Max demand Σ di+wi<DMAXi for all I,t (13) • We allow offers and bids to be made on energy & reserves. This problem is solved across multiple time periods, usually 24 hrs (1 hr at a time) but sometimes fewer (e.g, 4 or 6) and sometimes more. The above is a simplified version. The MISO Business Practice Manual BPM-002-r11, Chapter 4, provides a detailed description of the SCUC. See https://www.midwestiso.org/Library/BusinessPracticesManuals/Pages/BusinessPracticesManuals.aspx.
Two markets: “Energy & operating reserve” are 2 different markets, 1 for buying/selling energy, 1 for buying/selling operating reserve. Co-optimization: The first “SC” in SC-SCED/SC-SCUC stands for “simultaneous co-optimized” referring to the fact that both energy & operating reserve markets are cleared within 1 optimization formulation. Reserves: Regulation reserve supplies minute-by-minute variation in net-demand via AGC. Spinning/supplemental reserve provide backup for contingencies (gen loss). Spinning is inter-connected, supplemental need not be; both must be available within 10 mins of a request. Use of SC-SCED: In DAM, SC-SCUC solves once per hour and then for that hour, SC-SCED is also solved. RTM uses the RT commitment as input to SC-SCED in computing RT dispatch every 5 minutes. LMPs: SC-SCUC gives hourly commitment & dispatch, but no nodal prices (LMPs). SC-SCED (given a commitment) gives dispatch & nodal prices. Contingencies: Transmission security constraints for SC-SCUC are enforced via a predefined constraint list for the SCUC and a simultaneous feasibility testing (SFT) function iterating with SCED. Two markets - comments
Electricity “two settlement” markets Internet system Energy & reserve offers from gens Which gens get committed, at roughly what levels for next 24 hours, and settlement Day-Ahead Market (every day) Energy bids from loads Generates 100 mw; paid $100. Energy offers from gens Internet system Generation levels for next 5 minutes and settlement for deviations from day-ahead market Real-Time Market (every 5 minutes) Energy bids from loads Generates 99 mw; pays $1. 25
Locational marginal prices • Units are $/MWhr • One for each bus in the network. • If the network is lossless, transmission capacity is infinite, then all buses have the same LMP, λ. In this case, λ is the increase in system cost if total load increases by 1 unit (corresponds to simple market we will see). • With a lossy and congested network, LMPk is the increase in cost of bus k MW load increases by 1 unit. 26
RT LMPs in the MISO and PJM balancing areas 7:20 am (CST) 9/8/2011 Source: MISO - PJM Interconnection Joint and Common Market Web site, previously at www.miso-pjm.com/ but not maintained. 28
RT LMPs in the MISO and PJM balancing areas 7:40 am (CST) 9/8/2011 Source: MISO - PJM Interconnection Joint and Common Market Web site, previously at www.miso-pjm.com/ but not maintained. 29
RT LMPs in the MISO and PJM balancing areas - temporal variation for four different nodes 6:00 am-noon (CST) 8/28/2012 32
RT LMPs in the MISO balancing area https://www.midwestiso.org/MarketsOperations/RealTimeMarketData/Pages/RealTimeMarketData.aspx March 4, 2013, 10:20 CST 33
Ancillary services in the MISO balancing area https://www.midwestiso.org/MarketsOperations/RealTimeMarketData/Pages/RealTimeMarketData.aspx March 4, 2013, 10:20 CST 34
Market prices - Energy Real-Time 8:25 am (CST) 6/4/2013 35
Market prices – Ancillary Services Day-ahead: hour ending 9 am (CST) 6/4/2013 Real-Time: 8:25 am (CST) 6/4/2013 36
Day-ahead LMPs in ISO-NE balancing areas For hour ending 11:00 am (EST) 9/8/2011 New England ISO website, at http://www.iso-ne.com/portal/jsp/lmpmap/Index.jsp but no longer available. 37
RT LMPs in the ISO-NE balancing areas 10:25 am (EST) 9/8/2011 New England ISO website, at http://www.iso-ne.com/portal/jsp/lmpmap/Index.jsp but no longer available. 38
RTAncillary service prices in ISO-NE bal areas TMSR=10min spinning rsrv TMNSR=10min non-spinning rsrv TMOR=30min operating rsrv Regulation clearing price is $5.11/MW. Load Zones: Connecticut (CT), Southwest CT (SWCT), Northeast Massachusetts/Boston (NEMABSTN) 10:25 am (EST) 9/8/2011 New England ISO website, at http://www.iso-ne.com/portal/jsp/lmpmap/Index.jsp but no longer available. 39
Market time line Ref: A. Botterud, J. Wang, C. Monteiro, and V. Miranda “Wind Power Forecasting and Electricity Market Operations,” available at www.usaee.org/usaee2009/submissions/OnlineProceedings/Botterud_etal_paper.pdf
ADS: automatic dispatch system DOT: dispatch operating target Focus on interval 2, { t+5, t+10}. For interval 2, a short-term net load forecast is made 7.5 min before interval 2 begins, at t-2.5, and generation set points are computed accordingly via SCED. At t+2.5, which is 2.5 minutes before interval 2 begins, the units start to move. The units are ramped at a rate which provides that they reach the desired base point at t+7.5 min, which is 2.5 min after the interval begins. Base point calculation via real-time market Key point: The base point is computed from a net load forecast. There is error in this forecast, which typically increases as wind penetration increases. This error contributes to power imbalance and therefore frequency deviation. Source: Y. Makarov, C. Loutan, J. Ma, and P. de Mello, “Operational impacts of wind generation on California power systems,” IEEE Trans on Power Systems, Vol. 24, No. 2, May 2009. 41
How did wind participate in markets? Price ($/MWhr) Demand schedule without wind Point X Supply schedule without wind Quantity (MWhr) • “Old” approach • Participates in day-ahead energy market • Does not participate in day-ahead AS market • Does not participate in RTM • Wind generates what it can (self-scheduled/price-taker) • No deviation penalties • Paid based on computed LMP without wind, Point X below • Marginal unit backed off Does not affect supply curve! An excellent summary of wind and markets for all North American ISOs (as of Oct. 2011) can be found at http://www.uwig.org/windinmarketstableOct2011.pdf. 42
How does wind participate in markets? • “New” Midwest ISO approach: • Dispatchable intermittent resource (DIR) • Participates in day-ahead energy • Makes offer into RT market like any other generator. But one unique DIR feature: • Instead of capacity max offered in by other generation resources, the forecasted wind MW is used as the operation capacity maximum; • Units are expected to follow the dispatch signal; • Units missing “schedule band” of 8% on either side of dispatch instruction for four consecutive 5-min periods are penalized. • What are implications? 43
How does wind participate in markets? • What are implications? • Wind is dispatchable! Forecasting is key! • DIRs are expected to provide rolling forecast of 12 five-minute periods for the Forecast Maximum Limit. • If forecast not submitted in time, MISO forecast is used. • Each 5 minute dispatch optimization uses Forecast Maximum Limit based on the following order • 1. Participant submitted Forecast for the interval • Must be less than or equal to the Feasibility Limit • Must have been submitted less than 30 minutes ago • 2.MISO Forecast • Must be less than or equal to the Feasibility Limit • Must have been created less than 30 minutes ago • 3.State Estimator 44
Why is DIR beneficial? (from MISO document) 1. The entire market benefits when more resources are fully integrated into the Energy Market. Specifically, operational efficiency and market transparency will be improved, since fewer manual wind curtailments will be necessary, and LMPs will reflect each resource that impacts a constraint(s). For these reasons, registration as DIR is consistent with Good Utility Practice. 2. The automated dispatch for DIRs will be more efficient than the manual curtailment process currently in place for Intermittent Resources. This will lead to more optimal economic solutions that utilize wind more completely than a manual process. 3. The make -whole provisions of the tariff apply to DIRs, whereas they do not apply to Intermittent Resources. If a DIR is unprofitably dispatched above its Day-Ahead position, it is eligible for the RT Offer Revenue Sufficiency Guarantee (RSG) Payment provisions of the tariff. If a DIR is dispatched below its Day-Ahead position, and does not maintain its Day-Ahead margin, it is eligible for the Day Ahead Margin Assurance Payment provisions of the Tariff. This provides DIRs with assurance that dispatches, both upward and downward, will be economical. See https://www.midwestiso.org/Library/Repository/Communication%20Material/Strategic%20Initiatives/DIR%20FAQ.pdf. 47
Why is DIR beneficial? • Inclusion of the DIRs in the RT dispatch provides that DIR offers are optimized by SCED. • This provides more flexibility to manage constraints. Therefore, there will be fewer manual curtailments, which benefits wind for increased MWhrs produced, and benefits others because it can be predicted (improves transparency). • Benefits to system because wind offers low and therefore affects all time periods some (has very large effect during peak periods) – see next slide. Why does wind offer low when its LCOE is high? Because markets incentivize agents to offer their marginal cost (cost of producing the next MW) to be dispatched. This is the value for which they break-even in the short-term. Since wind requires no fuel, its marginal costs are mainly maintenance-related and subsequently low compared to marginal cost of fuel-based units. How then, can wind energy be profitable in the long-term, if it is offering prices that are lower than its LCOE?. It is because markets settle at the clearing price, i.e., (assuming infinite transmission & no losses), everyone gets paid the clearing price, not their offer price 48
Why is DIR beneficial? Difference in prices with (solid) and without (dashed) wind. Slanted lines are demand curves for night, day, and peak. Without wind, prices are slightly higher at night, significantly higher during the day, and much higher during the peak. “Wind energy and Electricity Prices: Exploring the “merit order effect”,” a literature review by Poyry for the European Wind Energy Association, April , 2010., available at www.ewea.org/fileadmin/ewea_documents/documents/publications/reports/MeritOrder.pdf. 49