Download
1 / 16
180 likes | 356 Views
Learn how to test hypotheses for single sample problems. Identify null and alternative hypotheses, use P-value approach, compute test statistics, make decisions, and understand errors in hypothesis testing. Clear examples included.

E N D
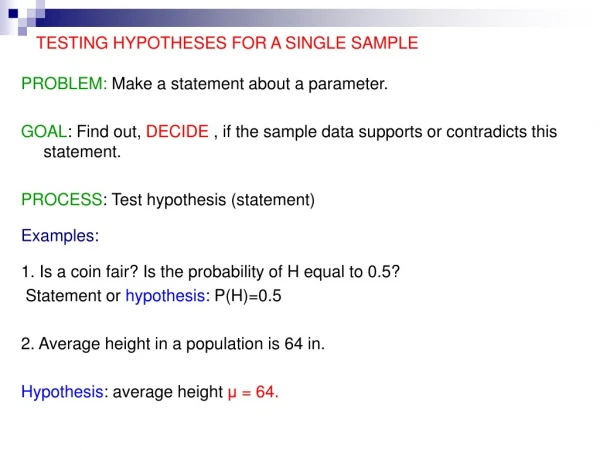
TESTING HYPOTHESES FOR A SINGLE SAMPLE PROBLEM: Make a statement about a parameter. GOAL: Find out, DECIDE , if the sample data supports or contradicts this statement. PROCESS: Test hypothesis (statement) Examples: 1. Is a coin fair? Is the probability of H equal to 0.5? Statement or hypothesis: P(H)=0.5 2. Average height in a population is 64 in. Hypothesis: average height μ = 64.
TESTING HYPOTHESIS - INTRODUCTION Definition. A hypothesis is a statement about an unknown parameter. Based on sample data we TEST if the HYPOTHESIS is true or false. DECISION: Accept or reject hypothesis. - If the hypothesis is consistent with the data, we accept it (no reason to reject it). - Otherwise, we reject the hypothesis in favor of an alternative relative to which we judge our hypothesis.
NULL AND ALTERNATIVE HYPOTHESES • Null hypothesis Ho – statement denoting “no effect”, “no change”. • Alternative hypothesis Ha - reflects “expected change”, “research hypothesis”. IDEA: We hold on to Ho as true and reject it ONLY IF there is sufficient evidence against it. EXAMPLE: A coin is tossed 100 times and gives 62 H. Is it a fair coin? Assume the coin is fair until proven otherwise. Ho: P(H)=0.5 Alternative? Coin is not fair. Ha: P(H) ≠ 0.5 Two sided alternative (possible values of P(H) on both sides of 0.5)
NULL AND ALTERNATIVE HYPOTHESES –EXAMPLES CONTD. One sided alternatives. 1. Coin tossing example contd. New question. Does the coin favor H? Ho: P(H)=0.5 Ha: P(H) > 0.5 2. Suppose the coin came up H 25 times. One sided alternatives Does the coin favor T? Ho: P(H) = 0.5 Ha: P(H) < 0.5 Example2. A new drug comes to market for high blood pressure. Decide if it is significantly better than the old one. Ho: Old drug same as new drug Ha: New drug better than old drug (both drugs equally effective) (new drug more effective than old one)
EXAMPLE Average score on midterms in a calculus class in the past years was 70. This year a sample of 100 students averaged 73. Are the students smarter this year? Assume scores follow a normal distribution with σ=10. Solution. Let μ= true mean midterm score this year (unknown), X = score, sample mean σ=10, n=100, X ~ N(μ, 10). Ho:μ= 70 (no change from last yr) Ha: μ > 70 (smarter students this yr) If Ho true, how likely is it to observe of 73 or higher? By CLT (or Fact 2), so very small! So, the data suggests that Ho is not true. DECISION: Reject Ho. CONCLUSION: Students are smarter this year.
NOTES • The data is the truth. • If the chances of observing what actually happened are small if Ho is true, then the data tells us that Ho is not true. • If the data we observed are likely to come up when Ho is true, the data supports Ho. • When in doubt about one sided alternative, use two sided alternative.
TESTING HYPOTHESES: P-VALUE APPROACH QUESTION: How to make the decision TO REJECT OR NOT Ho? A p-value is the probability of observing a value of the test statistic at least as contradictory to Ho (favoring Ha) as the observed value, when Ho is assumed to be true. In the calc test example, for the sample of 100 observations with sample mean 73: p-value=P( given that μ=70) = 0.0013. If p-value is small probability of observing what we observed if Ho is true is small we have evidence against Horeject Ho. Typically, we reject Ho for p-values below 0.01 or 0.05. P-value is also called observed significance level.
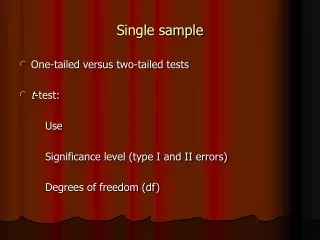
One sample Z-test for the mean of a normal population Let sample from N(μ, σ), μ-unknown,σ – known. Test Ho: μ = μo versus Ho: μ ≠μo Test statistic: P-value: 2P( Z > |z|) One sided tests p-values: Ho: μ > μo, P-value: P( Z > z) Ho: μ < μo, P-value: P( Z < z)
COMPUTING P-values Example1. Calculus midterm contd. Suppose a sample of n=25 observations yielded the mean of 73. Would you still conclude that the students are smarter this year? Solution. Ho:μ= 70 (no change from last yr) Ha: μ > 70 (smarter students this yr) P-value = P-value = 0.0668 > 0.05, not sufficiently small to reject Ho. Decision: Do not reject Ho. Why difference with the previous example? The sample size! Variability of the sample mean now is larger, so the observed result could have happened by chance. Could be result of chance variability.
COMPUTING P-values Example 2. Suppose a sample of n=25 students yielded sample mean of 68 and we want to test Ho: Ho:μ= 70 Ha: μ ≠ 70 (two sided alternative) Test statistic: z = (68 – 70)/(10/√25) = -1. P-value = 2P( Z > |-1|) =2P(Z > 1) = 2(0.1587) = 0.3174. P-value is quite large. Decision: Do not reject Ho.
TESTING HYPOTHES: FIXED LEVEL OF SIGNIFICANCE APPROACH 2 TYPES OF ERROR: Type I Error: Reject Ho when it is true. Type II Error: Do not reject Ho when it is false. LEVEL OF SIGNIFICANCE αOF A TEST = probability of Type I error we are willing to tolerate. Our procedures are constructed in such a way that they have minimal chance of Type II error for a given significance level α. Usually significance level is given/decided before any data is collected. Significance level is up to the researcher.
TESTING HYPOTHESES ABOUT THE MEAN OF THE NORMAL DISTRIBUTION, σ KNOWN: FIXED LEVEL OF SIGNIFICANCE PROCEDURE: ONE SAMPLE Z-TEST STEP 1. Ho: μ = μoHa: μ ≠ μo or Ha: μ > μo or Ha: μ < μo STEP 2. Compute the test statistic: STEP 3. Compute the critical number/value for the test Find the critical/rejection region for the test. The critical value depends on Ha. Two sided alternative critical value = zα/2. One sided alternative critical value = zα.
FIXED LEVEL OF SIGNIFICANCE PROCEDURE contd. STEP 4. DECISION-critical/rejection regions: depend on Ha. Ha: μ ≠ μo Reject Ho if |z|> zα/2; Ha: μ > μo Reject Ho if z > zα; Ha: μ < μo Reject Ho if z < - zα. STEP 5. Answer the question in the problem.
EXAMPLES 1. Suppose the verbal SAT score for 100 students gives average of 500, and it is known that σ =100. Test the hypothesis that the true mean SAT score for this population is 475 versus a two sided alternative. Use significance level α = 5%. Solution. n=100, σ=100, μo=475, α = 5%. STEP1. Ho: μ = 475 Ha: μ ≠ 475 STEP 2. Test statistic STEP3. Critical value zα/2= z0.025= 1.96. STEP 4. z=2.5 > 1.96 reject Ho. STEP5. True mean SAT score for this pop. differs significantly from 475.
EXAMPLES, contd. 2. Suppose that the mean height of men is 66”. A sample of 36 women yielded mean height of 62”. Are women, on average, shorter than men? Use σ =10 and 1% significance level. Compute p-value for your test. Solution. n=36, ,σ=10, μo=66, α = 1%. STEP1. Ho: μ = 66 Ha: μ < 66 STEP 2. Test statistic STEP3. Critical value zα= z0.01= 2.33. STEP 4. z = - 2.4 < -2.33, reject Ho. STEP5. On average, women are shorter than men. P-value =