Download
1 / 14
140 likes | 245 Views
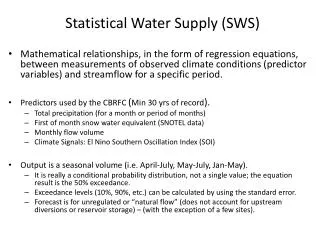
Statistical Water Supply Index (SWSI). Surface Water Supply is the reservoir storage at the beginning of, plus the natural streamflow during, the primary snowmelt and growing season relevant to the region of interest.

E N D
Statistical Water Supply Index (SWSI) • Surface Water Supply is the reservoir storage at the beginning of, plus the natural streamflow during, the primary snowmelt and growing season relevant to the region of interest. • Index is an appropriately scaled numeric indicator of the status of the elements used to calculate the surface water supply.
History of Statistical Water Supply Index (SWSI) • Originally developed in early 1980s in Colorado • Original formulation, with variations, also adopted by Montana and Oregon • Procedure reviewed by NRCS in cooperation with Colorado Climate Center in early 1990s • Revised formulation based on water supply forecasts published in 1993 • New formulation, with variations, adopted by Idaho, New Mexico, and Colorado
Original Formulation of SWSI where: P = nonexceedance probability (%) of respective hydrologic variable a, b, c, d = subjective weights
Limitations of Original Formulation of SWSI • Statistical properties of the combination of non-exceedance probabilities are not known • Subjective weights • No explicit definition of surface water supply
Revised Formulation of SWSI where: P = non-exceedance probability (%) of reservoir storage + observed or forecasted streamflow (season dependent) 50 = centers the distribution on zero 12 = scales to existing ranges for drought existing indexes
Streamflow Variable Used in Revised Formulation of SWSI • Streamflow forecast is used when available, otherwise use previous month's streamflow as alternate. • Official streamflow forecasts are available January - May or June • Forecasts during summer and fall months should be possible in areas with significant ENSO signal and/or relationship with previous month's precipitation
Example Monthly Formulation - CO • Oct-Nov: Obs. Res. Storage + Obs. Streamflow • Dec: Obs. Res. Storage + Apr-Jul / Sep volume based on Dec 1 SWE / SOI as relevant • Jan-Apr: Obs. Res. Storage + Apr-Jul /Sep volume forecasts
Example Monthly Formulation - CO • May: Obs. Res. Storage + Apr-Jul / Sep volume forecasts - Apr runoff • Jun: Obs. Res. Storage + Apr-Jul / Sep volume forecasts - (Apr-May) runoff • Jul-Sep: Obs. Res. Storage + previous month’s obs. Streamflow
Additional Considerations • Data Sources:Precipitation, snowpack, streamflow, reservoir storage. • Centralized / De-Centralized computation • Actual spatial representation:Entire basin / “ribbon” along the river • Presentation:Graphic / Tabular
Proposed Initial Selections • Climate - UCAN • Streamflow - NWIS • De-Centralized --> Centralized • River-Ribbon presentation • Graphic and Tabular